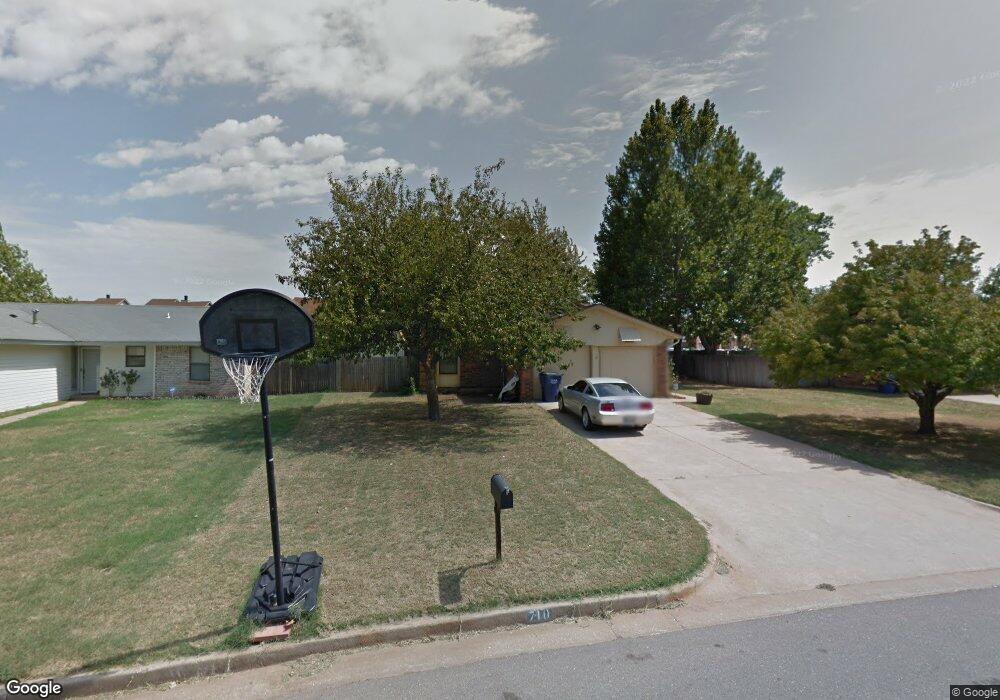
710 N Pine Branch Way Mustang, OK 73064
Estimated Value: $163,000 - $186,000
3
Beds
2
Baths
983
Sq Ft
$176/Sq Ft
Est. Value
About This Home
This home is located at 710 N Pine Branch Way, Mustang, OK 73064 and is currently estimated at $173,417, approximately $176 per square foot. 710 N Pine Branch Way is a home located in Canadian County with nearby schools including Mustang Centennial Elementary School, Mustang Horizon Intermediate School, and Mustang Middle School.
Ownership History
Date
Name
Owned For
Owner Type
Purchase Details
Closed on
Apr 8, 2025
Sold by
Gulley Nicholas Alan
Bought by
Gulley Vanessa M
Current Estimated Value
Purchase Details
Closed on
Jul 26, 2018
Sold by
Gulley Nicholas Alan and Gulley Vanessa M
Bought by
Gulley Nicholas Alan and Gulley Vanessa M
Home Financials for this Owner
Home Financials are based on the most recent Mortgage that was taken out on this home.
Original Mortgage
$96,000
Interest Rate
4.5%
Mortgage Type
New Conventional
Purchase Details
Closed on
Jul 18, 2011
Sold by
Kinyon Glenn W and Kinyon Krista
Bought by
Gulley Nicholas Alan
Home Financials for this Owner
Home Financials are based on the most recent Mortgage that was taken out on this home.
Original Mortgage
$88,351
Interest Rate
5.25%
Mortgage Type
FHA
Purchase Details
Closed on
Oct 27, 2000
Sold by
Kopp Leslie J
Purchase Details
Closed on
Mar 23, 1992
Sold by
Conversion
Create a Home Valuation Report for This Property
The Home Valuation Report is an in-depth analysis detailing your home's value as well as a comparison with similar homes in the area
Home Values in the Area
Average Home Value in this Area
Purchase History
| Date | Buyer | Sale Price | Title Company |
|---|---|---|---|
| Gulley Vanessa M | -- | None Listed On Document | |
| Gulley Vanessa M | -- | None Listed On Document | |
| Gulley Nicholas Alan | -- | Title Source Inc | |
| Gulley Nicholas Alan | $91,000 | Ort | |
| -- | $63,500 | -- | |
| -- | $36,000 | -- |
Source: Public Records
Mortgage History
| Date | Status | Borrower | Loan Amount |
|---|---|---|---|
| Previous Owner | Gulley Nicholas Alan | $96,000 | |
| Previous Owner | Gulley Nicholas Alan | $88,351 |
Source: Public Records
Tax History Compared to Growth
Tax History
| Year | Tax Paid | Tax Assessment Tax Assessment Total Assessment is a certain percentage of the fair market value that is determined by local assessors to be the total taxable value of land and additions on the property. | Land | Improvement |
|---|---|---|---|---|
| 2024 | $1,351 | $14,219 | $1,800 | $12,419 |
| 2023 | $1,351 | $13,542 | $1,800 | $11,742 |
| 2022 | $1,302 | $12,897 | $1,800 | $11,097 |
| 2021 | $1,245 | $12,283 | $1,800 | $10,483 |
| 2020 | $1,266 | $12,411 | $1,800 | $10,611 |
| 2019 | $1,240 | $12,156 | $1,800 | $10,356 |
| 2018 | $1,249 | $11,980 | $1,800 | $10,180 |
| 2017 | $1,178 | $11,428 | $1,800 | $9,628 |
| 2016 | $1,124 | $10,884 | $1,800 | $9,084 |
| 2015 | -- | $10,384 | $1,800 | $8,584 |
| 2014 | -- | $11,145 | $1,440 | $9,705 |
Source: Public Records
Map
Nearby Homes
- 0 N Mustang Rd
- 0 N Mustang Rd
- 338 W Crooked Branch Way
- 504 N Russell Terrace
- 413 W Pines Way
- 14900 SW 74th St
- 14842 SW 74th St
- 534 W Pine Rose Court Way
- 1125 N Savannah Terrace
- 301 E Richmond Terrace
- 10004 SW 38th St
- 10000 SW 38th St
- 3900 Olivia St
- 10016 SW 38th St
- 557 W Pine Rose Court Way
- 531 W Shadow Ridge Way
- 320 E Richmond Terrace
- 408 E Magnolia Terrace
- 413 E Plantation Terrace
- 3629 Blue Ave
- 706 N Pine Branch Way
- 714 N Pine Branch Way
- 702 N Pine Branch Way
- 713 N Pine Branch Way
- 717 N Pine Branch Way
- 718 N Pine Branch Way
- 616 N Pine Branch Way
- 709 N Pine Branch Way
- 705 N Pine Branch Way
- 16450 W State Highway 152
- 701 N Pine Branch Way
- 725 N Pine Branch Way
- 614 N Pine Branch Way
- 210 W Branches Way
- 218 W Branches Way
- 142 W Branches Way
- 222 W Branches Way
- 226 W Branches Way
- 625 N Pine Branch Way
- 101 Fieldstone Way