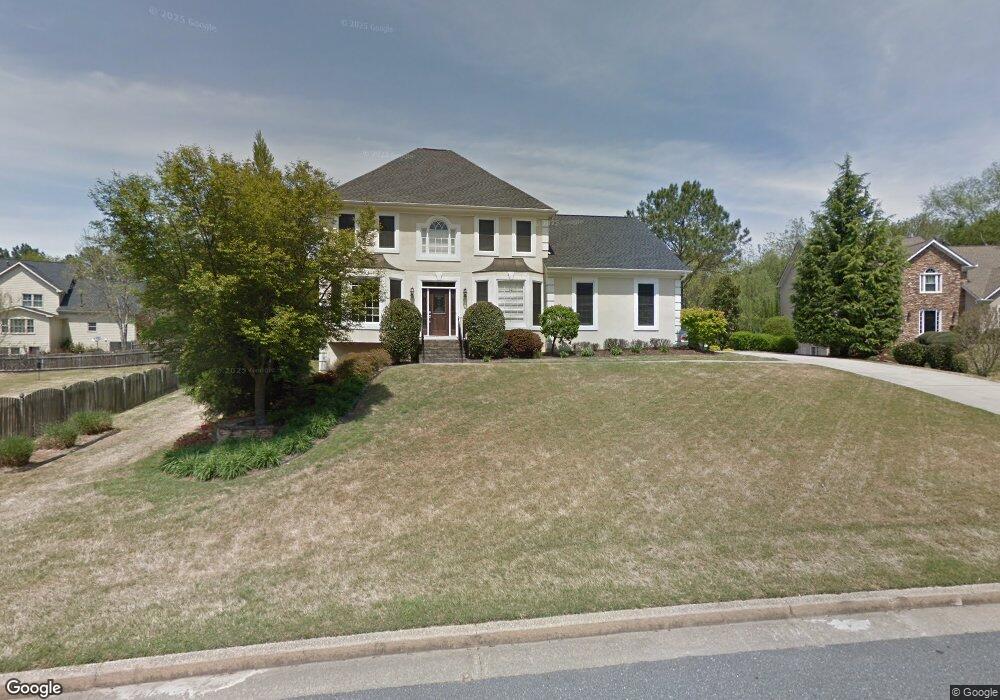
710 Paddock Ct Alpharetta, GA 30009
Estimated Value: $558,000 - $879,000
4
Beds
3
Baths
3,155
Sq Ft
$233/Sq Ft
Est. Value
About This Home
This home is located at 710 Paddock Ct, Alpharetta, GA 30009 and is currently estimated at $735,617, approximately $233 per square foot. 710 Paddock Ct is a home located in Fulton County with nearby schools including Alpharetta Elementary School, Northwestern Middle School, and Milton High School.
Ownership History
Date
Name
Owned For
Owner Type
Purchase Details
Closed on
Dec 27, 2004
Sold by
Gsamp Trust 2002 & He2 Mtg Pass
Bought by
Clinton Linda M
Current Estimated Value
Home Financials for this Owner
Home Financials are based on the most recent Mortgage that was taken out on this home.
Original Mortgage
$27,990
Interest Rate
5.63%
Mortgage Type
Stand Alone Refi Refinance Of Original Loan
Purchase Details
Closed on
Jun 1, 2004
Sold by
Williams Joan B
Bought by
Mortgage Electronic Registration
Purchase Details
Closed on
Jul 20, 1999
Sold by
Williams Douglas R
Bought by
Williams Joan B
Purchase Details
Closed on
Mar 8, 1993
Sold by
Hyman D B Inc
Bought by
Williams Douglas S Joan B
Home Financials for this Owner
Home Financials are based on the most recent Mortgage that was taken out on this home.
Original Mortgage
$162,950
Interest Rate
4.37%
Create a Home Valuation Report for This Property
The Home Valuation Report is an in-depth analysis detailing your home's value as well as a comparison with similar homes in the area
Home Values in the Area
Average Home Value in this Area
Purchase History
| Date | Buyer | Sale Price | Title Company |
|---|---|---|---|
| Clinton Linda M | $279,900 | -- | |
| Mortgage Electronic Registration | $287,939 | -- | |
| Williams Joan B | -- | -- | |
| Williams Douglas S Joan B | $181,100 | -- |
Source: Public Records
Mortgage History
| Date | Status | Borrower | Loan Amount |
|---|---|---|---|
| Closed | Clinton Linda M | $27,990 | |
| Previous Owner | Williams Douglas S Joan B | $162,950 |
Source: Public Records
Tax History Compared to Growth
Tax History
| Year | Tax Paid | Tax Assessment Tax Assessment Total Assessment is a certain percentage of the fair market value that is determined by local assessors to be the total taxable value of land and additions on the property. | Land | Improvement |
|---|---|---|---|---|
| 2025 | $740 | $227,520 | $51,400 | $176,120 |
| 2023 | $6,422 | $227,520 | $51,400 | $176,120 |
| 2022 | $3,724 | $220,120 | $30,560 | $189,560 |
| 2021 | $4,353 | $181,320 | $27,240 | $154,080 |
| 2020 | $4,384 | $183,320 | $25,520 | $157,800 |
| 2019 | $656 | $180,120 | $25,080 | $155,040 |
| 2018 | $4,306 | $175,880 | $24,480 | $151,400 |
| 2017 | $3,608 | $135,600 | $26,880 | $108,720 |
| 2016 | $3,607 | $135,600 | $26,880 | $108,720 |
| 2015 | $4,201 | $135,600 | $26,880 | $108,720 |
| 2014 | $2,400 | $91,040 | $21,480 | $69,560 |
Source: Public Records
Map
Nearby Homes
- 1510 Shade Tree Way
- 116 Emily Ln
- 170 Michaela Dr
- 1530 Rucker Rd
- 1395 Mid Broadwell Rd
- 3052 Steeplechase
- 3058 Steeplechase Unit 4
- 1614 Rucker Rd
- 1413 Bellsmith Dr
- 3018 Steeplechase
- 3016 Steeplechase Unit 3
- 1500 Mid Broadwell Rd
- 160 Watermill Falls
- 1386 Bellsmith Dr
- 1110 Upper Hembree Rd
- 910 Reece Rd
- 165 Foe Creek Ct
- 720 Paddock Ct
- 811 Smoke House Ct
- 2195 Fairfax Dr
- 821 Smoke House Ct
- 801 Smoke House Ct
- 715 Paddock Ct
- 730 Paddock Ct
- 705 Paddock Ct
- 725 Paddock Ct
- 831 Smoke House Ct
- 240 Greenmont Cir
- 230 Greenmont Cir Unit 2
- 250 Greenmont Cir Unit 2
- 250 Greenmont Cir
- 220 Greenmont Cir
- 810 Smoke House Ct
- 260 Greenmont Cir Unit 2
- 2200 Fairfax Dr
- 2165 Fairfax Dr
- 735 Paddock Ct