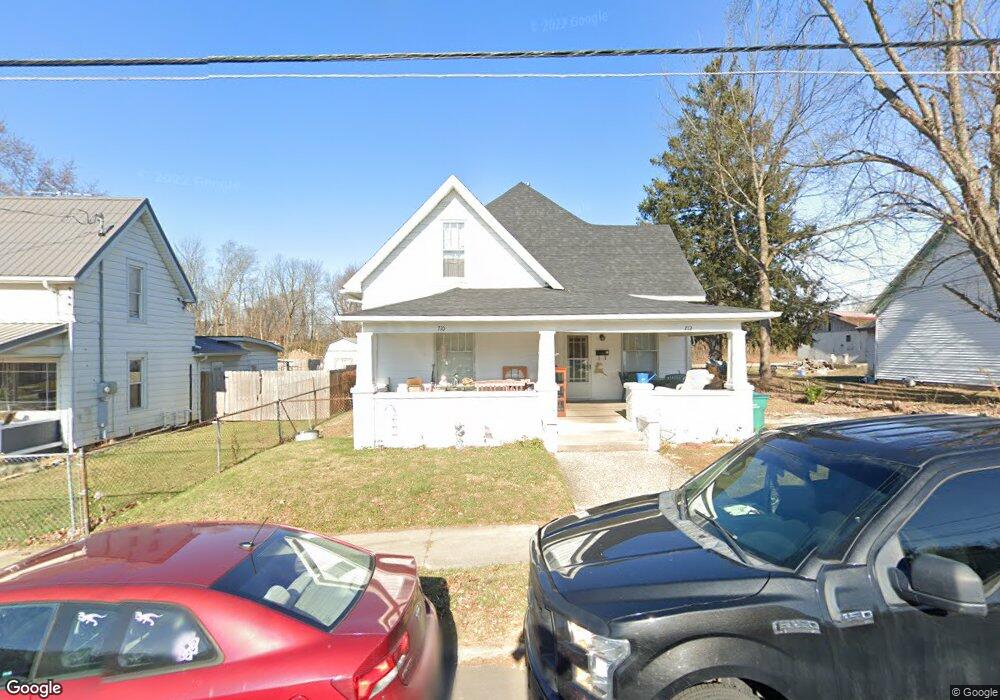
710 Spring St New Castle, IN 47362
Estimated Value: $95,000 - $228,000
5
Beds
1
Bath
2,672
Sq Ft
$54/Sq Ft
Est. Value
About This Home
This home is located at 710 Spring St, New Castle, IN 47362 and is currently estimated at $144,667, approximately $54 per square foot. 710 Spring St is a home located in Henry County with nearby schools including Agape Learning Center.
Ownership History
Date
Name
Owned For
Owner Type
Purchase Details
Closed on
Dec 28, 2021
Sold by
Beacon Enterprises Llc
Bought by
Rory G Llc
Current Estimated Value
Home Financials for this Owner
Home Financials are based on the most recent Mortgage that was taken out on this home.
Original Mortgage
$436,339
Outstanding Balance
$343,642
Interest Rate
2.39%
Mortgage Type
Future Advance Clause Open End Mortgage
Estimated Equity
-$198,975
Purchase Details
Closed on
Jun 21, 2013
Sold by
Venture Real Estate Llc
Bought by
Bondar Nick
Create a Home Valuation Report for This Property
The Home Valuation Report is an in-depth analysis detailing your home's value as well as a comparison with similar homes in the area
Home Values in the Area
Average Home Value in this Area
Purchase History
| Date | Buyer | Sale Price | Title Company |
|---|---|---|---|
| Rory G Llc | -- | None Available | |
| Bondar Nick | -- | None Available |
Source: Public Records
Mortgage History
| Date | Status | Borrower | Loan Amount |
|---|---|---|---|
| Open | Rory G Llc | $436,339 |
Source: Public Records
Tax History Compared to Growth
Tax History
| Year | Tax Paid | Tax Assessment Tax Assessment Total Assessment is a certain percentage of the fair market value that is determined by local assessors to be the total taxable value of land and additions on the property. | Land | Improvement |
|---|---|---|---|---|
| 2024 | $1,206 | $60,300 | $19,400 | $40,900 |
| 2023 | $1,164 | $58,200 | $19,400 | $38,800 |
| 2022 | $898 | $44,900 | $9,700 | $35,200 |
| 2021 | $750 | $37,500 | $8,500 | $29,000 |
| 2020 | $790 | $37,500 | $8,500 | $29,000 |
| 2019 | $793 | $37,600 | $8,500 | $29,100 |
| 2018 | $824 | $39,200 | $7,700 | $31,500 |
| 2017 | $953 | $45,500 | $7,700 | $37,800 |
| 2016 | $992 | $47,500 | $7,500 | $40,000 |
| 2014 | $503 | $25,100 | $8,800 | $16,300 |
| 2013 | $503 | $23,800 | $8,600 | $15,200 |
Source: Public Records
Map
Nearby Homes
- 922 Spring St
- 709 Broad St
- 203 S 7th St
- 201 S 11th St
- 000 S St Rd 103
- 909 Church St
- 1010 Church St
- 321 N Main St
- 504 N 12th St
- 313 S 7th St
- 1324 Thornburg St
- 411 Luellen Way
- 711 N 14th St
- 000 Wittenbraker Ave
- 701 Hawthorn Rd
- 400 S 14th St
- 1506 Kentucky Ave
- 630 S 11th St
- 1510 Michigan St
- 711 S 11th St