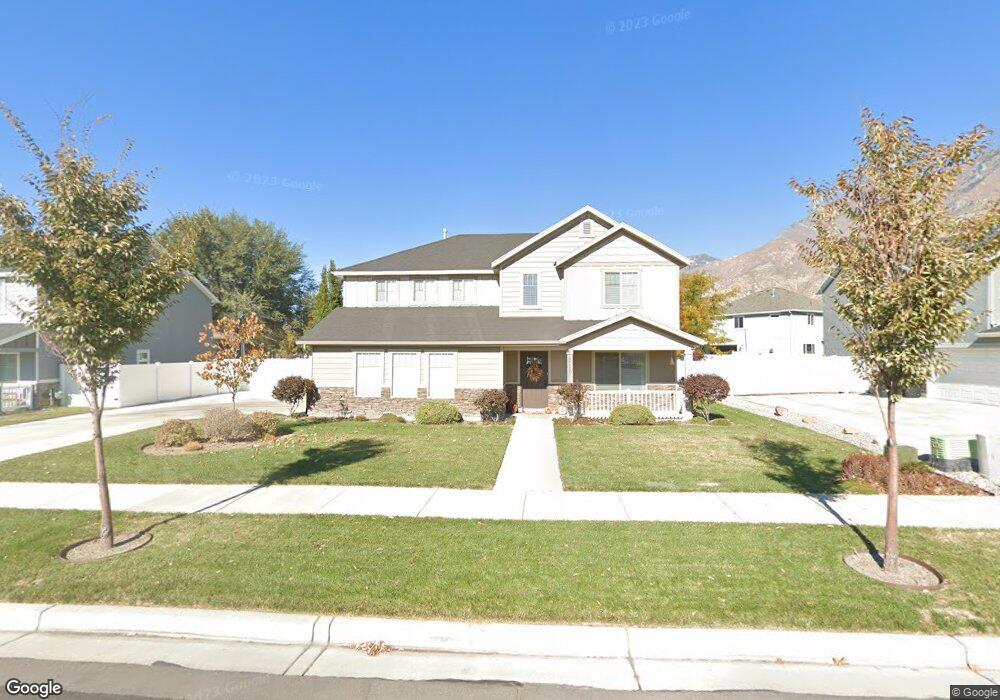
710 W 250 N Unit LOT 57 Springville, UT 84663
Westfields North NeighborhoodEstimated Value: $586,468 - $621,000
4
Beds
3
Baths
2,433
Sq Ft
$247/Sq Ft
Est. Value
About This Home
This home is located at 710 W 250 N Unit LOT 57, Springville, UT 84663 and is currently estimated at $601,367, approximately $247 per square foot. 710 W 250 N Unit LOT 57 is a home located in Utah County with nearby schools including Westside Elementary School, Springville Junior High School, and Springville High School.
Ownership History
Date
Name
Owned For
Owner Type
Purchase Details
Closed on
Jun 29, 2017
Sold by
Camberlango Development Group Llc
Bought by
Pettersson Michael J and Pettersson Clorinda
Current Estimated Value
Home Financials for this Owner
Home Financials are based on the most recent Mortgage that was taken out on this home.
Original Mortgage
$292,400
Outstanding Balance
$243,798
Interest Rate
4.02%
Estimated Equity
$357,569
Purchase Details
Closed on
Jun 5, 2015
Sold by
R & T Investments Llc
Bought by
Camberlango Development Group L L C
Purchase Details
Closed on
Apr 22, 2010
Sold by
Lre L C
Bought by
R & T Investments Lc
Create a Home Valuation Report for This Property
The Home Valuation Report is an in-depth analysis detailing your home's value as well as a comparison with similar homes in the area
Home Values in the Area
Average Home Value in this Area
Purchase History
| Date | Buyer | Sale Price | Title Company |
|---|---|---|---|
| Pettersson Michael J | -- | Provo Land Title Co | |
| Camberlango Development Group L L C | -- | Inwest Title | |
| R & T Investments Lc | -- | Accommodation |
Source: Public Records
Mortgage History
| Date | Status | Borrower | Loan Amount |
|---|---|---|---|
| Open | Pettersson Michael J | $292,400 |
Source: Public Records
Tax History Compared to Growth
Tax History
| Year | Tax Paid | Tax Assessment Tax Assessment Total Assessment is a certain percentage of the fair market value that is determined by local assessors to be the total taxable value of land and additions on the property. | Land | Improvement |
|---|---|---|---|---|
| 2025 | $2,782 | $540,300 | $191,000 | $349,300 |
| 2024 | $2,782 | $276,100 | $0 | $0 |
| 2023 | $2,755 | $276,045 | $0 | $0 |
| 2022 | $2,859 | $281,270 | $0 | $0 |
| 2021 | $2,447 | $374,300 | $123,700 | $250,600 |
| 2020 | $2,308 | $342,200 | $91,600 | $250,600 |
| 2019 | $2,030 | $306,100 | $88,200 | $217,900 |
| 2018 | $1,985 | $285,400 | $82,700 | $202,700 |
| 2017 | $868 | $66,200 | $0 | $0 |
| 2016 | $801 | $59,900 | $0 | $0 |
| 2015 | $751 | $57,200 | $0 | $0 |
| 2014 | $666 | $50,300 | $0 | $0 |
Source: Public Records
Map
Nearby Homes
- 728 W 250 N Unit LOT 56
- 694 W 250 N Unit LOT 58
- 719 W 300 N
- 701 W 300 N Unit 17
- 701 W 300 N
- 746 W 250 N Unit 55
- 746 W 250 N
- 692 W 250 N
- 743 W 300 N
- 743 W 300 N Unit 15
- 239 N 700 W
- 800 N 700 W
- 263 N 750 W Unit 52
- 302 N 700 W
- 302 N 700 W Unit 18
- 257 N 650 W
- 313 N 700 W
- 217 N 700 W
- 291 N 650 W
- 218 N 700 W