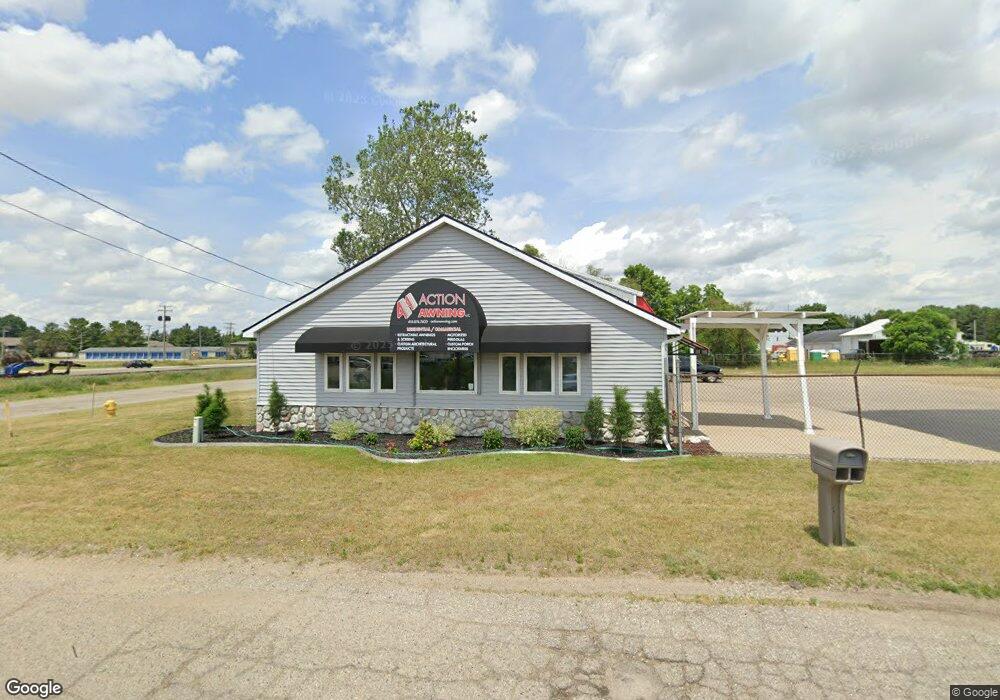
710 W Cherry St Wayland, MI 49348
Estimated Value: $153,824
Studio
1
Bath
3,456
Sq Ft
$45/Sq Ft
Est. Value
About This Home
This home is located at 710 W Cherry St, Wayland, MI 49348 and is currently estimated at $153,824, approximately $44 per square foot. 710 W Cherry St is a home located in Allegan County with nearby schools including Wayland High School, St. Therese Catholic School, and St. Stanislaus School.
Ownership History
Date
Name
Owned For
Owner Type
Purchase Details
Closed on
Nov 23, 2016
Sold by
Martin William C and Martin Rita M
Bought by
Jb Inpro Llc
Current Estimated Value
Purchase Details
Closed on
May 30, 2007
Sold by
Great Lakes Energy Cooperative
Bought by
B & R Excavating Inc
Purchase Details
Closed on
Dec 28, 1999
Bought by
Martin Bill and Martin Rita
Purchase Details
Closed on
Dec 23, 1999
Bought by
Martin William and Martin Rita
Purchase Details
Closed on
Jun 7, 1999
Bought by
B & R Excavating Inc
Create a Home Valuation Report for This Property
The Home Valuation Report is an in-depth analysis detailing your home's value as well as a comparison with similar homes in the area
Home Values in the Area
Average Home Value in this Area
Purchase History
| Date | Buyer | Sale Price | Title Company |
|---|---|---|---|
| Jb Inpro Llc | -- | A S K Services Inc | |
| Martin William C | -- | Attorney | |
| B & R Excavating Inc | $80,000 | None Available | |
| Martin Bill | $80,000 | -- | |
| Martin William | $80,000 | -- | |
| B & R Excavating Inc | $80,000 | -- |
Source: Public Records
Tax History
| Year | Tax Paid | Tax Assessment Tax Assessment Total Assessment is a certain percentage of the fair market value that is determined by local assessors to be the total taxable value of land and additions on the property. | Land | Improvement |
|---|---|---|---|---|
| 2025 | $6,201 | $115,900 | $38,600 | $77,300 |
| 2024 | $5,625 | $119,500 | $37,800 | $81,700 |
| 2023 | $5,625 | $97,100 | $16,100 | $81,000 |
| 2022 | $5,625 | $91,200 | $13,200 | $78,000 |
| 2020 | $5,378 | $88,200 | $13,200 | $75,000 |
| 2019 | $0 | $90,200 | $13,200 | $77,000 |
| 2018 | $0 | $83,300 | $13,200 | $70,100 |
| 2017 | $0 | $89,000 | $13,200 | $75,800 |
| 2016 | $0 | $59,100 | $7,300 | $51,800 |
| 2015 | -- | $59,100 | $7,300 | $51,800 |
| 2014 | -- | $73,200 | $20,000 | $53,200 |
| 2013 | -- | $68,300 | $20,000 | $48,300 |
Source: Public Records
Map
Nearby Homes
- 609 W Maple St
- 203 Vine St
- 1137 Regina Trail
- 518 Lawrence Ave Unit 5
- 1146 Saskatoon Trail
- 545 N Main St
- 1033 Aster St
- 146 Hanlon Ct
- 3770 Division Ave S
- 429 Plum St
- 826 Meadow Dr
- 401 Anderson Dr
- VL 13th St
- 329 Lotz Ct
- 535 135th Ave
- 3382 13th St
- 3905 Sunset View
- 986 129th Ave
- 4243 Butternut Dr
- 4245 Butternut Dr
Your Personal Tour Guide
Ask me questions while you tour the home.