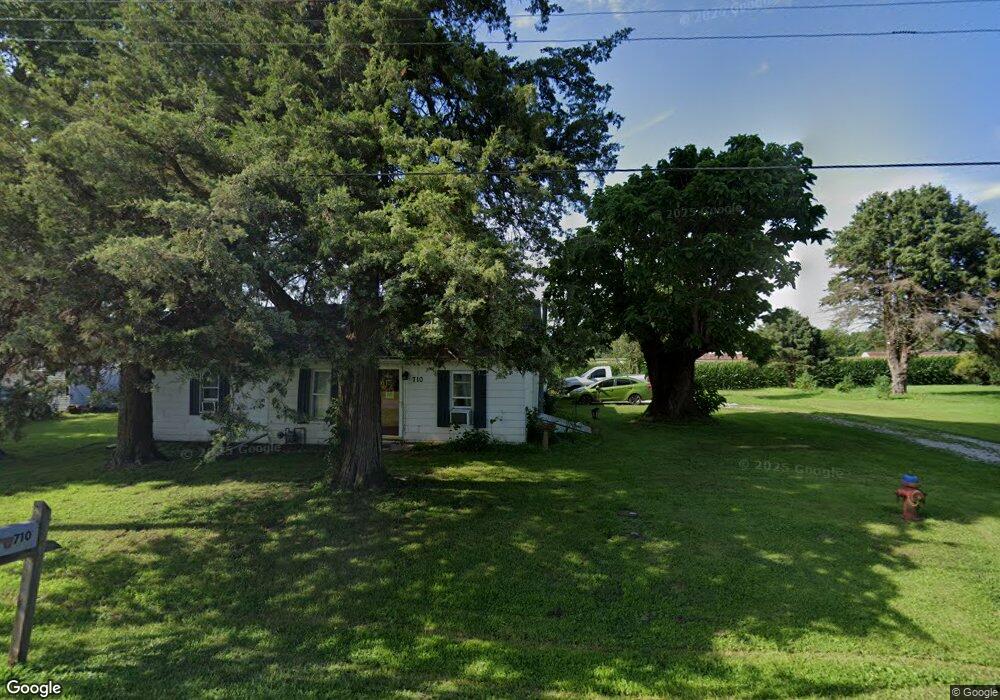
710 W Main St Little York, IL 61453
Estimated Value: $35,501 - $82,000
--
Bed
--
Bath
--
Sq Ft
9,148
Sq Ft Lot
About This Home
This home is located at 710 W Main St, Little York, IL 61453 and is currently estimated at $61,375. 710 W Main St is a home with nearby schools including United Junior High School and United High School.
Ownership History
Date
Name
Owned For
Owner Type
Purchase Details
Closed on
Sep 30, 2021
Sold by
Johnston Michael D and Johnston Bonita J
Bought by
Mccullough Tori R
Current Estimated Value
Home Financials for this Owner
Home Financials are based on the most recent Mortgage that was taken out on this home.
Original Mortgage
$22,307
Outstanding Balance
$20,342
Interest Rate
2.8%
Mortgage Type
New Conventional
Estimated Equity
$41,033
Purchase Details
Closed on
Sep 29, 2017
Sold by
Valdovinos Heather
Bought by
Johnston Michael D and Worthington Bonita J
Home Financials for this Owner
Home Financials are based on the most recent Mortgage that was taken out on this home.
Original Mortgage
$20,000
Interest Rate
5.75%
Mortgage Type
New Conventional
Purchase Details
Closed on
Nov 21, 2015
Sold by
Johnson Christina B
Bought by
Valdovinos Heather
Purchase Details
Closed on
Aug 15, 2014
Sold by
Johnson Frederick and Johnson Bonna J
Bought by
Johnson Christina Brooke
Purchase Details
Closed on
Apr 11, 2014
Sold by
Harding Frank and Harding Merri
Bought by
Johnson Frederick and Johnson Bonna J
Create a Home Valuation Report for This Property
The Home Valuation Report is an in-depth analysis detailing your home's value as well as a comparison with similar homes in the area
Home Values in the Area
Average Home Value in this Area
Purchase History
| Date | Buyer | Sale Price | Title Company |
|---|---|---|---|
| Mccullough Tori R | $27,000 | None Available | |
| Johnston Michael D | -- | -- | |
| Valdovinos Heather | $15,000 | Attorney | |
| Johnson Christina Brooke | -- | None Available | |
| Johnson Frederick | -- | None Available |
Source: Public Records
Mortgage History
| Date | Status | Borrower | Loan Amount |
|---|---|---|---|
| Open | Mccullough Tori R | $22,307 | |
| Previous Owner | Johnston Michael D | $20,000 |
Source: Public Records
Tax History Compared to Growth
Tax History
| Year | Tax Paid | Tax Assessment Tax Assessment Total Assessment is a certain percentage of the fair market value that is determined by local assessors to be the total taxable value of land and additions on the property. | Land | Improvement |
|---|---|---|---|---|
| 2024 | $385 | $10,480 | $1,510 | $8,970 |
| 2023 | $385 | $9,910 | $1,430 | $8,480 |
| 2022 | $270 | $9,160 | $1,320 | $7,840 |
| 2021 | $107 | $4,840 | $1,240 | $3,600 |
| 2020 | $111 | $4,840 | $1,240 | $3,600 |
| 2019 | $113 | $4,750 | $1,220 | $3,530 |
| 2018 | $113 | $1,280 | $1,230 | $50 |
| 2017 | $431 | $4,920 | $1,210 | $3,710 |
| 2016 | $336 | $4,800 | $1,180 | $3,620 |
| 2015 | -- | $8,390 | $1,140 | $7,250 |
| 2014 | -- | $8,270 | $1,120 | $7,150 |
| 2013 | -- | $8,470 | $1,150 | $7,320 |
Source: Public Records
Map
Nearby Homes
- 212 E Main St
- 2867 40th St
- 2723 70th St
- 26 Lake Warren Dr
- 86 & 87 Lake Warren Dr
- 2110 60th St
- 712 3rd St
- 701 3rd St
- 409 Maple St
- 2410 Township Rd 1500 E
- 1120 Kimberly Dr
- 620 N D St
- 820 W Boston Ave
- 922 W Archer Ave
- 410 N E St
- 703 W Boston Ave
- 511 N A St
- 316 E Franklin Ave
- 428 N 2nd St
- 302 W Broadway