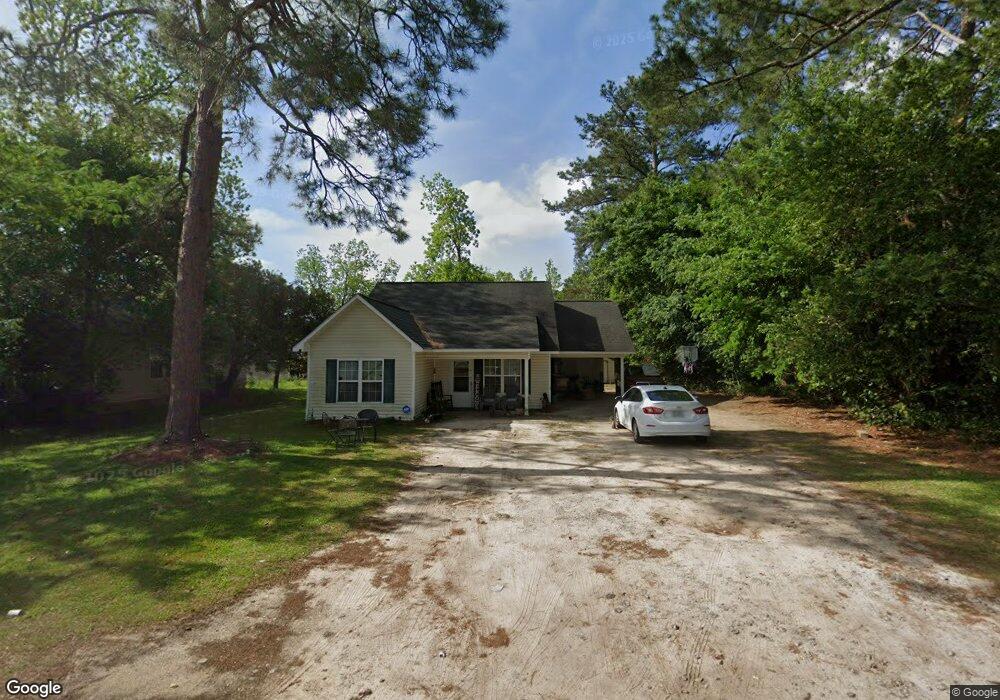
710 W Sultana Dr Fitzgerald, GA 31750
Estimated Value: $86,000 - $129,000
3
Beds
2
Baths
1,240
Sq Ft
$88/Sq Ft
Est. Value
About This Home
This home is located at 710 W Sultana Dr, Fitzgerald, GA 31750 and is currently estimated at $109,721, approximately $88 per square foot. 710 W Sultana Dr is a home located in Ben Hill County with nearby schools including Ben Hill County Primary School, Ben Hill Elementary School, and Ben Hill County Middle School.
Ownership History
Date
Name
Owned For
Owner Type
Purchase Details
Closed on
Jun 6, 2017
Bought by
Purvis Virgil
Current Estimated Value
Purchase Details
Closed on
Dec 19, 2007
Sold by
Cleghorn Larry C
Bought by
Jackson Albert G
Home Financials for this Owner
Home Financials are based on the most recent Mortgage that was taken out on this home.
Original Mortgage
$19,800
Interest Rate
6.15%
Mortgage Type
New Conventional
Purchase Details
Closed on
Dec 22, 2003
Sold by
Mortgage Lenders Network
Bought by
Cleghorn Larry C
Purchase Details
Closed on
Jun 4, 2002
Sold by
Williams Latreace
Bought by
Mortgage Lenders Network
Purchase Details
Closed on
Sep 10, 1998
Sold by
Downing R Wayne
Bought by
Williams Latreace
Purchase Details
Closed on
Mar 20, 1995
Bought by
Downing R Wayne
Create a Home Valuation Report for This Property
The Home Valuation Report is an in-depth analysis detailing your home's value as well as a comparison with similar homes in the area
Home Values in the Area
Average Home Value in this Area
Purchase History
| Date | Buyer | Sale Price | Title Company |
|---|---|---|---|
| Purvis Virgil | $30,000 | -- | |
| Jackson Albert G | $99,000 | -- | |
| Cleghorn Larry C | $3,000 | -- | |
| Mortgage Lenders Network | -- | -- | |
| Williams Latreace | $19,400 | -- | |
| Downing R Wayne | $12,000 | -- |
Source: Public Records
Mortgage History
| Date | Status | Borrower | Loan Amount |
|---|---|---|---|
| Previous Owner | Jackson Albert G | $19,800 | |
| Previous Owner | Jackson Albert G | $67,201 |
Source: Public Records
Tax History Compared to Growth
Tax History
| Year | Tax Paid | Tax Assessment Tax Assessment Total Assessment is a certain percentage of the fair market value that is determined by local assessors to be the total taxable value of land and additions on the property. | Land | Improvement |
|---|---|---|---|---|
| 2024 | $1,549 | $36,305 | $2,949 | $33,356 |
| 2023 | $1,054 | $34,381 | $2,208 | $32,173 |
| 2022 | $980 | $29,647 | $2,208 | $27,439 |
| 2021 | $966 | $28,102 | $2,457 | $25,645 |
| 2020 | $1,002 | $28,841 | $2,458 | $26,383 |
| 2019 | $968 | $27,959 | $2,458 | $25,501 |
| 2018 | $1,198 | $27,814 | $2,458 | $25,356 |
| 2017 | $759 | $21,811 | $2,458 | $19,353 |
| 2016 | -- | $21,811 | $2,458 | $19,353 |
| 2015 | -- | $30,246 | $2,458 | $27,789 |
| 2014 | -- | $30,826 | $2,458 | $28,368 |
Source: Public Records
Map
Nearby Homes
- 608 W Sultana Dr
- 906 N Merrimac Dr
- 502 W Alapaha St
- 606 W Suwanee St
- 123 Blueberry Ln
- 807 W Oconee St
- 141 Turner Ave
- 118 Patton Ave
- 303 W Altamaha St
- 124 N Main Street Extension
- 103 Meadowood Ln
- 124 Patton Ave
- 616 N Main St
- 613 W Central Ave
- 115 Easy St
- 503 N Main St
- 102 Irwinville Hwy
- 710 W Central Ave
- 816 W Central Ave
- 109 Pearl Place
- 716 W Sultana Dr
- 708 W Sultana Dr
- 807 N Hill St
- 702 W Sultana Dr
- 711 W Sultana Dr
- 707 W Sultana Dr
- 808 N Bragg St
- 715 W Sultana Dr
- 801 N Hill St
- 801 W Sultana Dr
- 804 N Bragg St
- 707 W Ohoopee St
- 705 W Sultana Dr
- 803 W Sultana Dr
- 811 N Bragg St
- 616 W Sultana Dr
- 807 W Sultana Dr
- 610 W Sultana Dr
- 807 N Bragg St
- 113 9th Ave