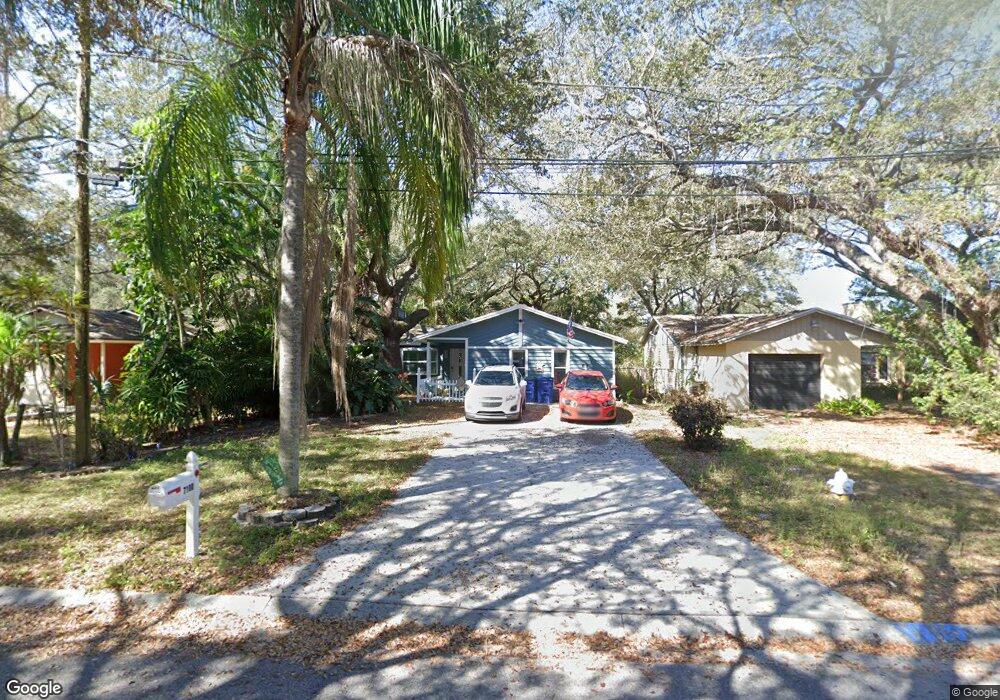
7100 72nd St N Pinellas Park, FL 33781
Estimated Value: $375,149 - $452,000
--
Bed
--
Bath
1,632
Sq Ft
$250/Sq Ft
Est. Value
About This Home
This home is located at 7100 72nd St N, Pinellas Park, FL 33781 and is currently estimated at $408,537, approximately $250 per square foot. 7100 72nd St N is a home located in Pinellas County with nearby schools including Marjorie Kinnan Rawlings Elementary School, Pinellas Park Middle School, and Hollins High School.
Ownership History
Date
Name
Owned For
Owner Type
Purchase Details
Closed on
Jul 9, 2020
Sold by
Stevens Josephine
Bought by
Kelly Karen Anne and Kelly Michael Joseph
Current Estimated Value
Home Financials for this Owner
Home Financials are based on the most recent Mortgage that was taken out on this home.
Original Mortgage
$220,543
Interest Rate
3.1%
Mortgage Type
FHA
Purchase Details
Closed on
Aug 15, 2003
Sold by
Stevens Richard C and Stevens Josephine
Bought by
Stevens Josephine
Purchase Details
Closed on
Jan 29, 2002
Sold by
Stevens Josephine
Bought by
Stevens Richard C and Stevens Josephine
Purchase Details
Closed on
Apr 23, 1997
Sold by
Foucher Henry A and Foucher Leslie J
Bought by
Stevens Josephine and Capicotto Angeline
Home Financials for this Owner
Home Financials are based on the most recent Mortgage that was taken out on this home.
Original Mortgage
$73,620
Interest Rate
7.85%
Mortgage Type
FHA
Create a Home Valuation Report for This Property
The Home Valuation Report is an in-depth analysis detailing your home's value as well as a comparison with similar homes in the area
Home Values in the Area
Average Home Value in this Area
Purchase History
| Date | Buyer | Sale Price | Title Company |
|---|---|---|---|
| Kelly Karen Anne | $255,000 | Luxe Title Services | |
| Stevens Josephine | -- | Attorney | |
| Stevens Richard C | $35,000 | -- | |
| Stevens Josephine | $84,500 | -- |
Source: Public Records
Mortgage History
| Date | Status | Borrower | Loan Amount |
|---|---|---|---|
| Previous Owner | Kelly Karen Anne | $220,543 | |
| Previous Owner | Stevens Josephine | $100,000 | |
| Previous Owner | Stevens Josephine | $73,620 |
Source: Public Records
Tax History Compared to Growth
Tax History
| Year | Tax Paid | Tax Assessment Tax Assessment Total Assessment is a certain percentage of the fair market value that is determined by local assessors to be the total taxable value of land and additions on the property. | Land | Improvement |
|---|---|---|---|---|
| 2024 | $4,070 | $241,132 | -- | -- |
| 2023 | $4,070 | $234,109 | $0 | $0 |
| 2022 | $3,973 | $227,290 | $0 | $0 |
| 2021 | $4,033 | $220,670 | $0 | $0 |
| 2020 | $1,538 | $106,550 | $0 | $0 |
| 2019 | $1,498 | $104,154 | $0 | $0 |
| 2018 | $1,466 | $102,212 | $0 | $0 |
| 2017 | $1,441 | $100,110 | $0 | $0 |
| 2016 | $1,416 | $98,051 | $0 | $0 |
| 2015 | $1,425 | $97,369 | $0 | $0 |
| 2014 | $1,410 | $96,596 | $0 | $0 |
Source: Public Records
Map
Nearby Homes
- 7065 73rd St N
- 6831 Circle Creek Dr N
- 7943 72nd St N Unit 155
- 6747 Deer Pond Ln N
- 8025 73rd St N
- 7620 74th St N
- 6634 Woodland Blvd N Unit 3
- 6460 Bonnie Bay Cir N
- 6549 Creekview Terrace N
- 6720 Park Blvd N Unit 1
- 6720 Park Blvd N Unit 77
- 6656 Pinecrest Ln N
- 6482 71st St N
- 7831 72nd Way N Unit 121
- 7049 67th Way N
- 6982 79th Ave N
- 6704 70th Ave N
- 6346 Bonnie Bay Cir N
- 0 77th Ave N
- 7933 72nd St N Unit 154