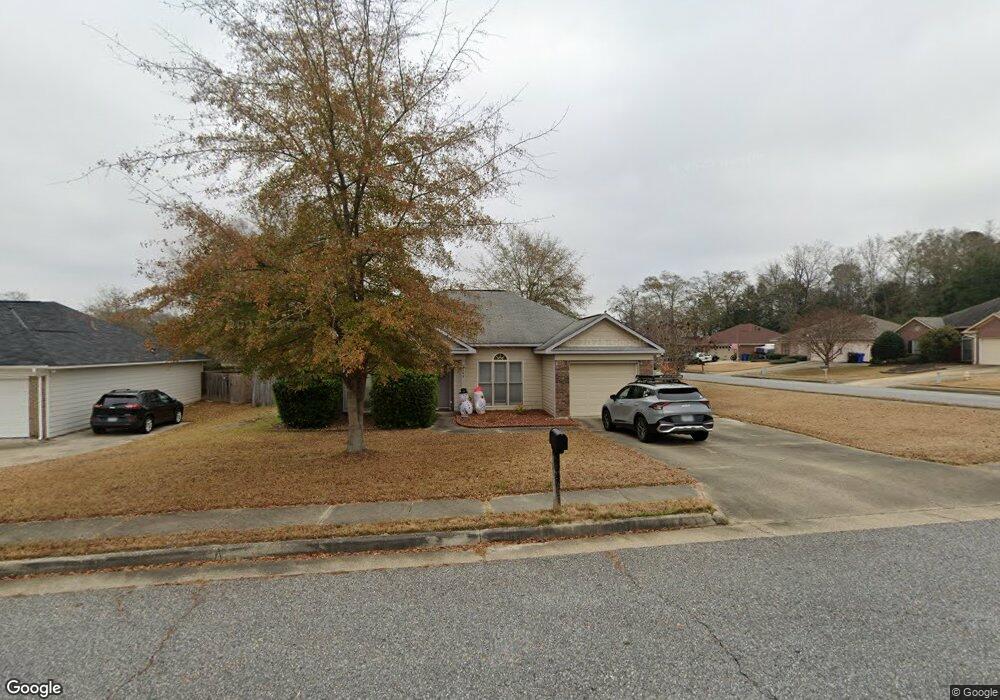
7100 Vinings Ct Columbus, GA 31907
Midland NeighborhoodEstimated Value: $223,508 - $237,000
3
Beds
2
Baths
1,408
Sq Ft
$166/Sq Ft
Est. Value
About This Home
This home is located at 7100 Vinings Ct, Columbus, GA 31907 and is currently estimated at $233,377, approximately $165 per square foot. 7100 Vinings Ct is a home located in Muscogee County with nearby schools including Mathews Elementary School, Aaron Cohn Middle School, and Shaw High School.
Ownership History
Date
Name
Owned For
Owner Type
Purchase Details
Closed on
Apr 16, 2020
Sold by
Beiker Holly
Bought by
Mccloskey Matthew
Current Estimated Value
Home Financials for this Owner
Home Financials are based on the most recent Mortgage that was taken out on this home.
Original Mortgage
$112,000
Outstanding Balance
$99,590
Interest Rate
3.6%
Mortgage Type
New Conventional
Estimated Equity
$133,787
Purchase Details
Closed on
Jun 20, 2016
Sold by
Tanner Jerry D
Bought by
Bieker Holly
Home Financials for this Owner
Home Financials are based on the most recent Mortgage that was taken out on this home.
Original Mortgage
$128,528
Interest Rate
3.75%
Mortgage Type
FHA
Purchase Details
Closed on
Feb 29, 2012
Sold by
Cain Kenneth R
Bought by
Tanner Jerry D
Home Financials for this Owner
Home Financials are based on the most recent Mortgage that was taken out on this home.
Original Mortgage
$129,730
Interest Rate
3.9%
Mortgage Type
VA
Create a Home Valuation Report for This Property
The Home Valuation Report is an in-depth analysis detailing your home's value as well as a comparison with similar homes in the area
Home Values in the Area
Average Home Value in this Area
Purchase History
| Date | Buyer | Sale Price | Title Company |
|---|---|---|---|
| Mccloskey Matthew | $156,000 | -- | |
| Bieker Holly | $130,900 | -- | |
| Tanner Jerry D | $127,000 | -- |
Source: Public Records
Mortgage History
| Date | Status | Borrower | Loan Amount |
|---|---|---|---|
| Open | Mccloskey Matthew | $112,000 | |
| Previous Owner | Bieker Holly | $128,528 | |
| Previous Owner | Tanner Jerry D | $129,730 |
Source: Public Records
Tax History Compared to Growth
Tax History
| Year | Tax Paid | Tax Assessment Tax Assessment Total Assessment is a certain percentage of the fair market value that is determined by local assessors to be the total taxable value of land and additions on the property. | Land | Improvement |
|---|---|---|---|---|
| 2025 | $2,065 | $65,928 | $15,012 | $50,916 |
| 2024 | $206 | $65,928 | $15,012 | $50,916 |
| 2023 | $1,382 | $65,928 | $15,012 | $50,916 |
| 2022 | $2,427 | $59,444 | $15,012 | $44,432 |
| 2021 | $2,506 | $61,364 | $15,012 | $46,352 |
| 2020 | $1,351 | $46,472 | $15,012 | $31,460 |
| 2019 | $1,357 | $46,472 | $15,012 | $31,460 |
| 2018 | $1,357 | $46,472 | $15,012 | $31,460 |
| 2017 | $1,363 | $46,472 | $15,012 | $31,460 |
| 2016 | $1,548 | $50,800 | $9,000 | $41,800 |
| 2015 | $1,551 | $50,800 | $9,000 | $41,800 |
| 2014 | $1,553 | $50,800 | $9,000 | $41,800 |
| 2013 | -- | $50,800 | $9,000 | $41,800 |
Source: Public Records
Map
Nearby Homes
- 7170 Beaver Run Rd
- 6437 Woodbriar Ln
- 7265 E Wynfield Loop
- 2 Mink Ct
- 7593 Beaver Run Rd
- 6321 Milgen Rd Unit 3
- 5 Mink Ct
- 5717 Flat Rock Rd
- 7613 Mockernut Way
- 6544 Mink Dr
- 6606 Widgeon Dr
- 6055 Psalmond Rd
- 6601 Psalmond Rd
- 6834 Beaver Trail
- 7101 Cross Tie Dr
- 5434 Rockhurst Dr
- 6454 Patriot Dr
- 6236 Olde Towne Dr
- 6215 Parker Dr
- 5640 Lakeshore Rd
- 7104 Vinings Ct
- 7039 Vinings Way
- 7108 Vinings Ct
- 7047 Vinings Way
- 7030 Vinings Way
- 7101 Vinings Ct
- 7034 Vinings Way
- 7026 Vinings Way
- 7105 Vinings Ct
- 7057 Vinings Way
- 7038 Vinings Way
- 7112 Vinings Ct
- 7065 Vinings Way
- 7022 Vinings Way
- 7109 Vinings Ct
- 7042 Vinings Way
- 7015 Vinings Way
- 7071 Vinings Way
- 7116 Vinings Ct
- 7018 Vinings Way