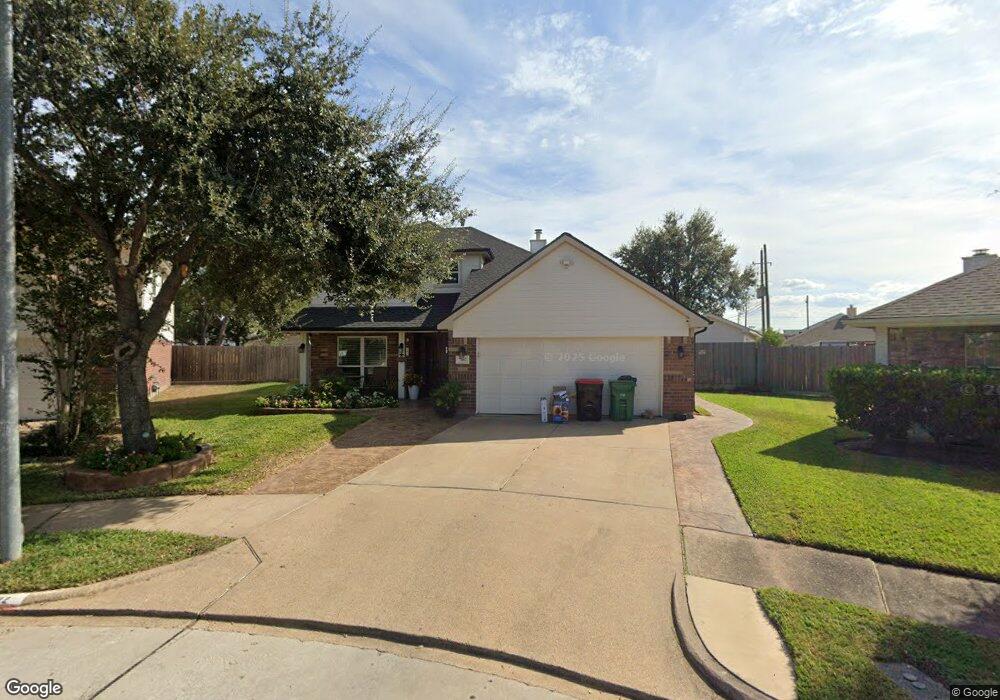
7102 Eldridge Chase Ct Houston, TX 77041
Hearthstone NeighborhoodEstimated Value: $306,300 - $317,000
4
Beds
3
Baths
2,200
Sq Ft
$141/Sq Ft
Est. Value
About This Home
This home is located at 7102 Eldridge Chase Ct, Houston, TX 77041 and is currently estimated at $310,575, approximately $141 per square foot. 7102 Eldridge Chase Ct is a home located in Harris County with nearby schools including Hairgrove Elementary School, Labay Middle School, and Cypress Falls High School.
Ownership History
Date
Name
Owned For
Owner Type
Purchase Details
Closed on
Jul 1, 2021
Sold by
Velazquez Ana Lilia Leija
Bought by
Leija Gisela Vasquez
Current Estimated Value
Purchase Details
Closed on
Oct 1, 2019
Sold by
Leija Hector M
Bought by
Leija Velazquez Ana Lilia
Purchase Details
Closed on
Aug 14, 2008
Sold by
Pete Troy K and Pete Charese C
Bought by
Leija Hector M
Home Financials for this Owner
Home Financials are based on the most recent Mortgage that was taken out on this home.
Original Mortgage
$119,049
Interest Rate
6.29%
Mortgage Type
FHA
Purchase Details
Closed on
Nov 29, 2000
Sold by
Lennar Homes Of Texas Inc
Bought by
Pete Troy K and Pete Charese C
Home Financials for this Owner
Home Financials are based on the most recent Mortgage that was taken out on this home.
Original Mortgage
$121,500
Interest Rate
11.45%
Create a Home Valuation Report for This Property
The Home Valuation Report is an in-depth analysis detailing your home's value as well as a comparison with similar homes in the area
Home Values in the Area
Average Home Value in this Area
Purchase History
| Date | Buyer | Sale Price | Title Company |
|---|---|---|---|
| Leija Gisela Vasquez | -- | None Listed On Document | |
| Leija Velazquez Ana Lilia | -- | None Available | |
| Leija Hector M | -- | None Available | |
| Pete Troy K | -- | -- |
Source: Public Records
Mortgage History
| Date | Status | Borrower | Loan Amount |
|---|---|---|---|
| Previous Owner | Leija Hector M | $119,049 | |
| Previous Owner | Pete Troy K | $121,500 |
Source: Public Records
Tax History Compared to Growth
Tax History
| Year | Tax Paid | Tax Assessment Tax Assessment Total Assessment is a certain percentage of the fair market value that is determined by local assessors to be the total taxable value of land and additions on the property. | Land | Improvement |
|---|---|---|---|---|
| 2025 | $3,661 | $295,702 | $78,496 | $217,206 |
| 2024 | $3,661 | $318,321 | $78,496 | $239,825 |
| 2023 | $3,661 | $338,375 | $56,410 | $281,965 |
| 2022 | $8,038 | $302,401 | $43,277 | $259,124 |
| 2021 | $6,952 | $247,329 | $43,277 | $204,052 |
| 2020 | $6,930 | $236,981 | $31,339 | $205,642 |
| 2019 | $5,569 | $184,656 | $19,102 | $165,554 |
| 2018 | $1,587 | $168,971 | $19,102 | $149,869 |
| 2017 | $5,114 | $168,971 | $19,102 | $149,869 |
| 2016 | $4,663 | $157,196 | $14,625 | $142,571 |
| 2015 | $3,186 | $149,656 | $14,625 | $135,031 |
| 2014 | $3,186 | $134,951 | $14,625 | $120,326 |
Source: Public Records
Map
Nearby Homes
- 13122 Eldridge Chase
- 13202 Chasworth Dr
- 7402 Burkridge Dr
- 13322 Chaston Dr
- 13323 Firebrick Dr
- 7315 Weatherhill Ln
- 13219 Vista Brook Dr
- 13215 Vista Oro Dr
- 7530 Lemma Dr
- 7511 Weatherhill Ln
- 7315 Millbrae Ln
- 7635 Log Cradle Dr
- 7607 Wovenwood Ln
- 7310 Blenheim Palace Ln
- 6647 Signat Dr
- 14311 Islandwoods Dr
- 12931 Blackbrook Ln
- 7618 Mauna Kai Dr
- 7823 Autumn Hollow Ln
- 14510 Sanour Dr
- 7106 Eldridge Chase Ct
- 7103 Eldridge Chase Ct
- 7002 Piney Meadow Ct
- 7110 Eldridge Chase Ct
- 7107 Eldridge Chase Ct
- 7107 Verde Meadow Ct
- 7006 Piney Meadow Ct
- 7003 Piney Meadow Ct
- 13215 Eldridge Chase
- 7111 Verde Meadow Ct
- 7103 Verde Meadow Ct
- 7010 Piney Meadow Ct
- 13202 Eldridge Chase
- 13126 Eldridge Chase
- 13219 Eldridge Chase
- 13206 Eldridge Chase
- 7115 Verde Meadow Ct
- 7007 Piney Meadow Ct
- 13210 Eldridge Chase
- 13118 Eldridge Chase