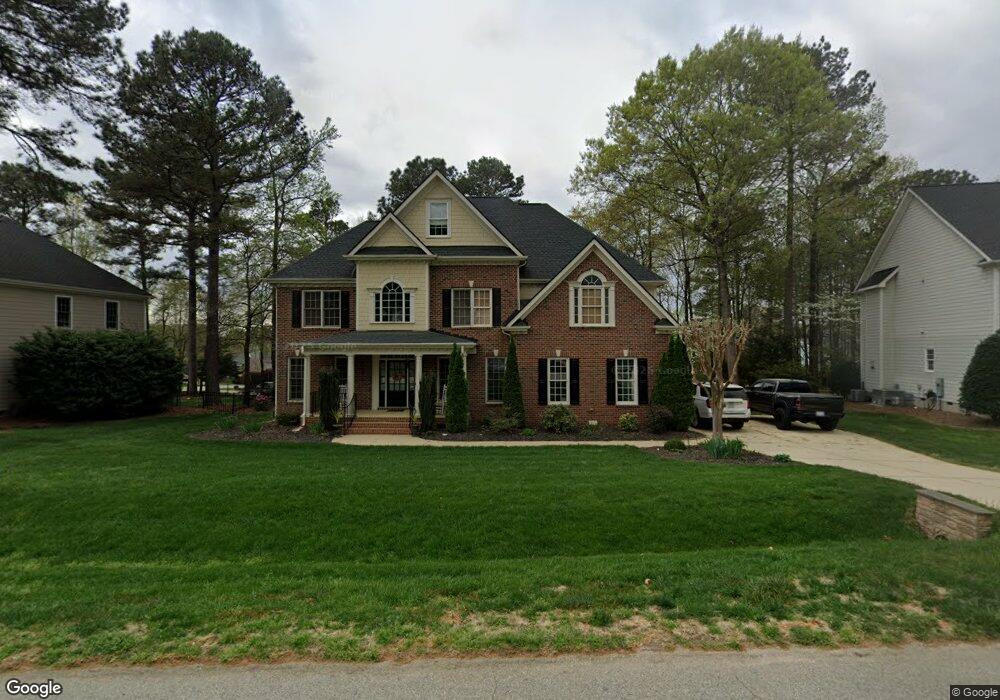
7105 Capulin Crest Dr Apex, NC 27539
Middle Creek NeighborhoodEstimated Value: $750,000 - $806,000
4
Beds
3
Baths
2,818
Sq Ft
$272/Sq Ft
Est. Value
About This Home
This home is located at 7105 Capulin Crest Dr, Apex, NC 27539 and is currently estimated at $766,646, approximately $272 per square foot. 7105 Capulin Crest Dr is a home located in Wake County with nearby schools including West Lake Elementary School, West Lake Middle, and Middle Creek High.
Ownership History
Date
Name
Owned For
Owner Type
Purchase Details
Closed on
Nov 5, 2019
Sold by
Marian Amy J and Hawkins Sarah E
Bought by
Hawkins James F and Hawkins Sarah E
Current Estimated Value
Purchase Details
Closed on
Jun 27, 2007
Sold by
Rogers Sarah S
Bought by
Hawkins Ii James F and Marian Amy J
Home Financials for this Owner
Home Financials are based on the most recent Mortgage that was taken out on this home.
Original Mortgage
$328,000
Interest Rate
6.35%
Mortgage Type
Purchase Money Mortgage
Purchase Details
Closed on
Feb 24, 2005
Sold by
Armstrong Custom Homes Inc
Bought by
Rogers Sarah S
Home Financials for this Owner
Home Financials are based on the most recent Mortgage that was taken out on this home.
Original Mortgage
$295,000
Interest Rate
5.68%
Mortgage Type
Fannie Mae Freddie Mac
Create a Home Valuation Report for This Property
The Home Valuation Report is an in-depth analysis detailing your home's value as well as a comparison with similar homes in the area
Home Values in the Area
Average Home Value in this Area
Purchase History
| Date | Buyer | Sale Price | Title Company |
|---|---|---|---|
| Hawkins James F | -- | None Available | |
| Hawkins Ii James F | $410,000 | None Available | |
| Rogers Sarah S | $400,000 | -- |
Source: Public Records
Mortgage History
| Date | Status | Borrower | Loan Amount |
|---|---|---|---|
| Previous Owner | Hawkins Ii James F | $328,000 | |
| Previous Owner | Rogers Sarah S | $295,000 | |
| Previous Owner | Rogers Sarah S | $64,910 |
Source: Public Records
Tax History Compared to Growth
Tax History
| Year | Tax Paid | Tax Assessment Tax Assessment Total Assessment is a certain percentage of the fair market value that is determined by local assessors to be the total taxable value of land and additions on the property. | Land | Improvement |
|---|---|---|---|---|
| 2025 | -- | $746,197 | $145,000 | $601,197 |
| 2024 | $6,277 | $746,197 | $145,000 | $601,197 |
| 2023 | $4,808 | $477,840 | $85,000 | $392,840 |
| 2022 | $4,629 | $477,840 | $85,000 | $392,840 |
| 2021 | $4,536 | $477,840 | $85,000 | $392,840 |
| 2020 | $4,559 | $477,840 | $85,000 | $392,840 |
| 2019 | $4,749 | $441,676 | $85,000 | $356,676 |
| 2018 | $4,456 | $441,676 | $85,000 | $356,676 |
| 2017 | $4,282 | $441,676 | $85,000 | $356,676 |
| 2016 | $4,218 | $441,676 | $85,000 | $356,676 |
| 2015 | -- | $452,383 | $75,000 | $377,383 |
| 2014 | $4,218 | $452,383 | $75,000 | $377,383 |
Source: Public Records
Map
Nearby Homes
- 333 Calvander Ln
- 120 Corapeake Way
- 124 Corapeake Way
- 128 Corapeake Way
- 104 Corapeake Way
- 6025 Larboard Dr
- 8401 Piney Branch Dr
- 5045 Homeplace Dr
- 7404 Bedford Ridge Dr
- 804 Blue Thorn Dr
- 5340 Serene Forest Dr
- 3101 Sawyers Mill Dr
- 3408 Sawyers Mill Dr
- 8224 Bells Lake Rd
- 8220 Bells Lake Rd
- 8405 Bells Lake Rd
- 212 Sea Biscuit Ln Unit 25
- 3712 Sawyers Mill Dr
- 3909 Langston Cir
- 102 Jamison Woods Ln
- 141 Fairport Ln
- 124 Fairport Ln
- 132 Fairport Ln
- 137 Fairport Ln
- 128 Fairport Ln
- 129 Fairport Ln
- 125 Fairport Ln
- 121 Fairport Ln
- 113 Fairport Ln
- 116 Fairport Ln
- 108 Fairport Ln
- 7101 Capulin Crest Dr
- 7109 Capulin Crest Dr
- 4912 Mashpee Ln
- 4916 Mashpee Ln
- 7104 Capulin Crest Dr
- 7113 Capulin Crest Dr
- 7108 Capulin Crest Dr
- 7100 Capulin Crest Dr
- 4920 Mashpee Ln