Estimated Value: $679,000 - $712,000
5
Beds
5
Baths
3,500
Sq Ft
$199/Sq Ft
Est. Value
About This Home
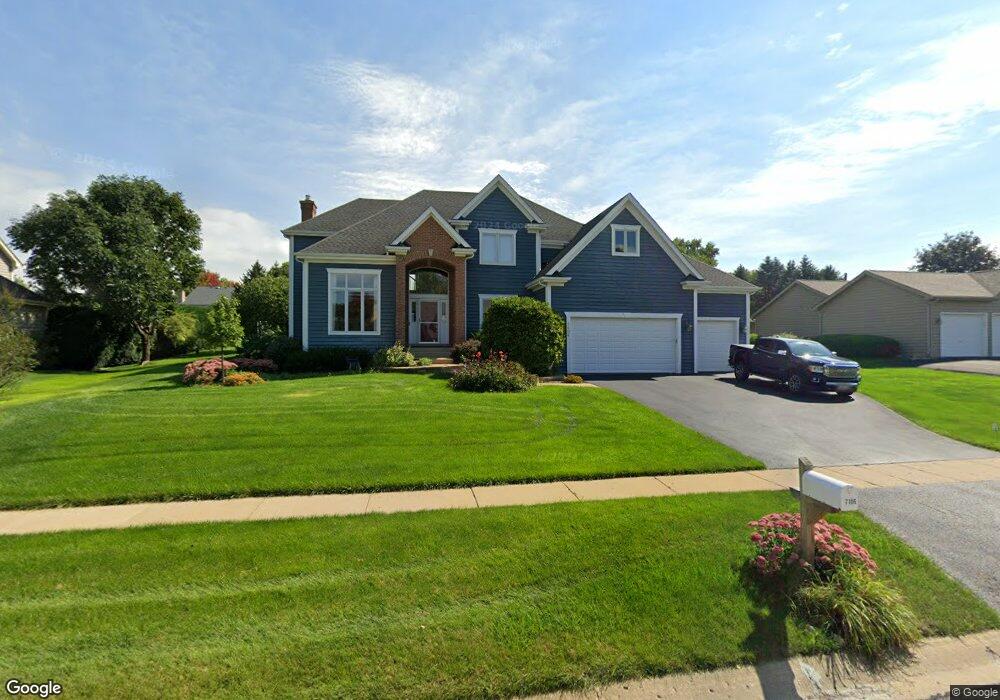
This home is located at 7106 Mallard Way, Cary, IL 60013 and is currently estimated at $697,018, approximately $199 per square foot. 7106 Mallard Way is a home located in McHenry County with nearby schools including Three Oaks Elementary School, Cary Jr High School, and Cary Grove High School.
Ownership History
Date
Name
Owned For
Owner Type
Purchase Details
Closed on
Jul 15, 2011
Sold by
Krause Frank J and Krause Jennifer L
Bought by
Burtschi Daniel J and Burtschi Michele P
Current Estimated Value
Home Financials for this Owner
Home Financials are based on the most recent Mortgage that was taken out on this home.
Original Mortgage
$320,000
Outstanding Balance
$24,012
Interest Rate
4.52%
Mortgage Type
New Conventional
Estimated Equity
$673,006
Purchase Details
Closed on
Apr 1, 2005
Sold by
Muirfield Builders Inc
Bought by
Krause Frank J and Krause Jennifer L
Home Financials for this Owner
Home Financials are based on the most recent Mortgage that was taken out on this home.
Original Mortgage
$428,000
Interest Rate
5.37%
Mortgage Type
Purchase Money Mortgage
Purchase Details
Closed on
Dec 14, 2000
Sold by
Harris Bank Barrington
Bought by
Muirfield Builders Inc
Create a Home Valuation Report for This Property
The Home Valuation Report is an in-depth analysis detailing your home's value as well as a comparison with similar homes in the area
Home Values in the Area
Average Home Value in this Area
Purchase History
| Date | Buyer | Sale Price | Title Company |
|---|---|---|---|
| Burtschi Daniel J | $435,000 | First American Title Ins Co | |
| Krause Frank J | $535,000 | Cti | |
| Muirfield Builders Inc | $60,000 | -- |
Source: Public Records
Mortgage History
| Date | Status | Borrower | Loan Amount |
|---|---|---|---|
| Open | Burtschi Daniel J | $320,000 | |
| Previous Owner | Krause Frank J | $428,000 |
Source: Public Records
Tax History Compared to Growth
Tax History
| Year | Tax Paid | Tax Assessment Tax Assessment Total Assessment is a certain percentage of the fair market value that is determined by local assessors to be the total taxable value of land and additions on the property. | Land | Improvement |
|---|---|---|---|---|
| 2024 | $13,870 | $187,969 | $28,588 | $159,381 |
| 2023 | $13,578 | $168,114 | $25,568 | $142,546 |
| 2022 | $13,917 | $167,449 | $39,303 | $128,146 |
| 2021 | $13,288 | $155,998 | $36,615 | $119,383 |
| 2020 | $12,904 | $145,786 | $35,319 | $110,467 |
| 2019 | $12,658 | $139,535 | $33,805 | $105,730 |
| 2018 | $14,688 | $157,155 | $31,229 | $125,926 |
| 2017 | $14,429 | $148,050 | $29,420 | $118,630 |
| 2016 | $14,355 | $138,857 | $27,593 | $111,264 |
| 2013 | -- | $127,875 | $25,741 | $102,134 |
Source: Public Records
Map
Nearby Homes
- 1712 Squirrel Trail
- 0 Three Oaks Dr Unit MRD12417647
- 406 Catkins Way
- 380 Merion Dr
- LOT 02 Three Oaks Rd
- 1055 White Pine Dr
- 296 Foxford Dr Unit 1
- 365 Oakmont Dr
- 331 Parkstone Dr
- 322 Parkstone Dr
- 50 Erin Dr
- 515 Crest Dr
- 312 Wooded Knoll Dr
- 1415 Carmel Ln
- 336 W Margaret Terrace
- 305 Bell Dr
- 6414 Kingsbridge Dr
- 340 W Margaret Terrace
- 6407 Kingsbridge Dr
- 26 Wagner Dr
- 7104 Mallard Way
- 7108 Mallard Way
- 7102 Mallard Way
- 7200 Mallard Way
- 7107 Swan Way
- 1600 Squirrel Trail
- 7109 Swan Way
- 7105 Swan Way
- 7111 Swan Way
- 7103 Swan Way
- 7100 Mallard Way
- 7202 Mallard Way
- 7103 Mallard Way
- 1708 Squirrel Trail
- 7201 Mallard Way
- 1508 Stag Trail
- 7101 Swan Way
- 7002 Mallard Way
- 7101 Mallard Way
- 7203 Mallard Way