Estimated Value: $490,780 - $663,000
4
Beds
4
Baths
2,800
Sq Ft
$208/Sq Ft
Est. Value
About This Home
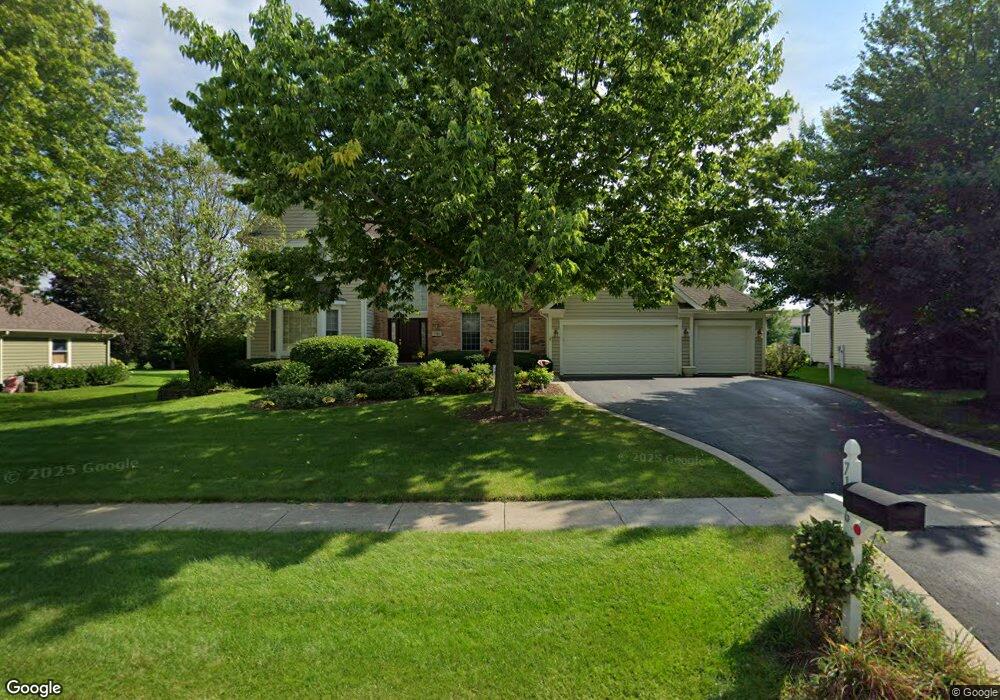
This home is located at 7106 Swallow Way, Cary, IL 60013 and is currently estimated at $582,195, approximately $207 per square foot. 7106 Swallow Way is a home located in McHenry County with nearby schools including Three Oaks Elementary School, Cary Jr High School, and Cary-Grove High School.
Ownership History
Date
Name
Owned For
Owner Type
Purchase Details
Closed on
Jan 23, 2026
Sold by
Coles Daniel J and Coles Ann M
Bought by
Coles Revocable Trust and Coles
Current Estimated Value
Purchase Details
Closed on
Jun 21, 2005
Sold by
Fron Danelle L
Bought by
Coles Daniel J and Coles Ann M
Home Financials for this Owner
Home Financials are based on the most recent Mortgage that was taken out on this home.
Original Mortgage
$279,750
Interest Rate
5.86%
Mortgage Type
Fannie Mae Freddie Mac
Purchase Details
Closed on
May 19, 2004
Sold by
Fron Michael and Fron Danelle L
Bought by
Fron Danelle L
Home Financials for this Owner
Home Financials are based on the most recent Mortgage that was taken out on this home.
Original Mortgage
$175,000
Interest Rate
5.12%
Mortgage Type
New Conventional
Purchase Details
Closed on
Jun 1, 2000
Sold by
Fron Michael and Fron Danelle
Bought by
Fron Danelle L
Purchase Details
Closed on
May 21, 1999
Sold by
Wallenfang Clifford
Bought by
Fron Michael and Fron Danelle
Home Financials for this Owner
Home Financials are based on the most recent Mortgage that was taken out on this home.
Original Mortgage
$330,300
Interest Rate
6.5%
Purchase Details
Closed on
Dec 28, 1998
Sold by
Wallenfang Clifford and Wallenfang Vicki A
Bought by
Clifford Wallenfang Revocable Trust
Home Financials for this Owner
Home Financials are based on the most recent Mortgage that was taken out on this home.
Original Mortgage
$240,000
Interest Rate
6.95%
Purchase Details
Closed on
Dec 23, 1998
Sold by
Wallenfang Clifford
Bought by
Wallenfang Clifford and Wallenfang Vicki A
Home Financials for this Owner
Home Financials are based on the most recent Mortgage that was taken out on this home.
Original Mortgage
$240,000
Interest Rate
6.95%
Purchase Details
Closed on
Mar 16, 1998
Sold by
Wallenfang Clifford and Wallenfang Vicki A
Bought by
Clifford Wallenfang Revocable Trust
Purchase Details
Closed on
May 15, 1997
Sold by
Verbance David A and Verbance Rebecca L
Bought by
Wallenfang Clifford and Wallenfang Vicki A
Home Financials for this Owner
Home Financials are based on the most recent Mortgage that was taken out on this home.
Original Mortgage
$250,000
Interest Rate
7.75%
Purchase Details
Closed on
May 22, 1995
Sold by
Vandelogt Construction Company
Bought by
Verbance David A and Verbance Rebecca L
Home Financials for this Owner
Home Financials are based on the most recent Mortgage that was taken out on this home.
Original Mortgage
$248,000
Interest Rate
8.42%
Create a Home Valuation Report for This Property
The Home Valuation Report is an in-depth analysis detailing your home's value as well as a comparison with similar homes in the area
Home Values in the Area
Average Home Value in this Area
Purchase History
| Date | Buyer | Sale Price | Title Company |
|---|---|---|---|
| Coles Revocable Trust | -- | None Listed On Document | |
| Coles Daniel J | $479,750 | Ticor Title | |
| Fron Danelle L | -- | -- | |
| Fron Michael | -- | Chicago Title | |
| Fron Danelle L | -- | -- | |
| Fron Michael | $367,000 | -- | |
| Clifford Wallenfang Revocable Trust | -- | Universal Title Services Inc | |
| Wallenfang Clifford | -- | Universal Title Services Inc | |
| Clifford Wallenfang Revocable Trust | -- | -- | |
| Wallenfang Clifford | $346,500 | -- | |
| Verbance David A | $300,500 | -- |
Source: Public Records
Mortgage History
| Date | Status | Borrower | Loan Amount |
|---|---|---|---|
| Previous Owner | Coles Daniel J | $279,750 | |
| Previous Owner | Fron Michael | $175,000 | |
| Previous Owner | Fron Michael | $330,300 | |
| Previous Owner | Wallenfang Clifford | $240,000 | |
| Previous Owner | Wallenfang Clifford | $250,000 | |
| Previous Owner | Verbance David A | $248,000 |
Source: Public Records
Tax History
| Year | Tax Paid | Tax Assessment Tax Assessment Total Assessment is a certain percentage of the fair market value that is determined by local assessors to be the total taxable value of land and additions on the property. | Land | Improvement |
|---|---|---|---|---|
| 2024 | $10,994 | $145,530 | $27,354 | $118,176 |
| 2023 | $10,748 | $130,159 | $24,465 | $105,694 |
| 2022 | $11,635 | $136,609 | $38,986 | $97,623 |
| 2021 | $11,103 | $127,267 | $36,320 | $90,947 |
| 2020 | $10,779 | $122,761 | $35,034 | $87,727 |
| 2019 | $10,569 | $117,497 | $33,532 | $83,965 |
| 2018 | $12,899 | $138,750 | $30,976 | $107,774 |
| 2017 | $12,668 | $130,711 | $29,181 | $101,530 |
| 2016 | $12,598 | $122,595 | $27,369 | $95,226 |
| 2013 | -- | $118,490 | $25,532 | $92,958 |
Source: Public Records
Map
Nearby Homes
- Lot 10 Grove Ln
- Lot 11 Grove Ln
- 365 Oakmont Dr
- LOT 02 Three Oaks Rd
- 237 Foxford Dr
- 331 Parkstone Dr
- 4 Kenilworth Ct
- 680 Spruce Tree Dr
- 6414 Kingsbridge Dr
- 112 Pearl St
- 0000 Newbold Rd
- 317 Sterling Cir
- 392 W Margaret Terrace
- 124 E Main St
- 7149 Meadow Ln
- 128 E Main St
- 330 Park Ave
- 440 W James Way
- 349 Park Ave
- 6606 Silver Lake Rd
- 7108 Swallow Way
- 7104 Swallow Way
- 7200 Swallow Way
- 7103 Nighthawk Way
- 7102 Swallow Way
- 7201 Nighthawk Way
- 7109 Swallow Way
- 7107 Swallow Way
- 7202 Swallow Way
- 7105 Swallow Way
- 7111 Swallow Way
- 7100 Swallow Way
- 7103 Swallow Way
- 7201 Swallow Way
- 7203 Nighthawk Way
- 7101 Nighthawk Way
- 7002 Swallow Way
- 7101 Swallow Way
- 1304 Cougar Trail
- 7003 Nighthawk Way
Your Personal Tour Guide
Ask me questions while you tour the home.