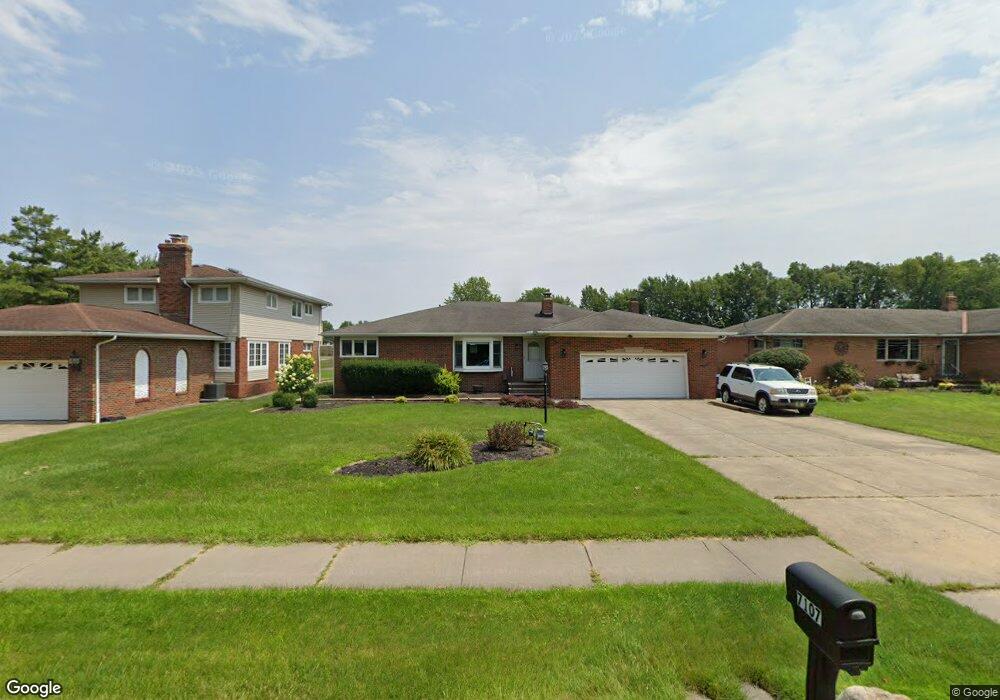
7107 Fitch Rd Olmsted Township, OH 44138
Estimated Value: $267,000 - $304,000
3
Beds
1
Bath
1,950
Sq Ft
$150/Sq Ft
Est. Value
About This Home
This home is located at 7107 Fitch Rd, Olmsted Township, OH 44138 and is currently estimated at $292,147, approximately $149 per square foot. 7107 Fitch Rd is a home located in Cuyahoga County with nearby schools including Falls-Lenox Primary Elementary School, Olmsted Falls Intermediate Building, and Olmsted Falls Middle School.
Ownership History
Date
Name
Owned For
Owner Type
Purchase Details
Closed on
Nov 10, 2016
Sold by
Welch Christopher
Bought by
Welch Sarah
Current Estimated Value
Home Financials for this Owner
Home Financials are based on the most recent Mortgage that was taken out on this home.
Original Mortgage
$108,109
Outstanding Balance
$87,011
Interest Rate
3.5%
Mortgage Type
FHA
Estimated Equity
$205,136
Purchase Details
Closed on
Mar 13, 2014
Sold by
Coury Kelly and Coury John
Bought by
Welch Christoher
Purchase Details
Closed on
Dec 27, 2013
Sold by
Coury John P and Coury Lauren
Bought by
Coury Kelly
Purchase Details
Closed on
Jul 30, 2003
Sold by
Coury Dorothy
Bought by
Coury John P
Home Financials for this Owner
Home Financials are based on the most recent Mortgage that was taken out on this home.
Original Mortgage
$110,500
Interest Rate
5.3%
Mortgage Type
Purchase Money Mortgage
Purchase Details
Closed on
Jan 1, 1975
Bought by
Coury John P and Coury Dorothy A
Create a Home Valuation Report for This Property
The Home Valuation Report is an in-depth analysis detailing your home's value as well as a comparison with similar homes in the area
Home Values in the Area
Average Home Value in this Area
Purchase History
| Date | Buyer | Sale Price | Title Company |
|---|---|---|---|
| Welch Sarah | $126,000 | Northstar Title Services | |
| Welch Christoher | $95,328 | Land Title Group | |
| Coury Kelly | $91,423 | Land Title Group | |
| Coury John P | $130,000 | -- | |
| Coury John P | -- | -- |
Source: Public Records
Mortgage History
| Date | Status | Borrower | Loan Amount |
|---|---|---|---|
| Open | Welch Sarah | $108,109 | |
| Previous Owner | Coury John P | $110,500 |
Source: Public Records
Tax History Compared to Growth
Tax History
| Year | Tax Paid | Tax Assessment Tax Assessment Total Assessment is a certain percentage of the fair market value that is determined by local assessors to be the total taxable value of land and additions on the property. | Land | Improvement |
|---|---|---|---|---|
| 2024 | $6,283 | $84,665 | $7,700 | $76,965 |
| 2023 | $5,685 | $62,580 | $5,950 | $56,630 |
| 2022 | $5,677 | $62,580 | $5,950 | $56,630 |
| 2021 | $5,623 | $62,580 | $5,950 | $56,630 |
| 2020 | $5,340 | $52,610 | $5,010 | $47,600 |
| 2019 | $4,818 | $150,300 | $14,300 | $136,000 |
| 2018 | $4,676 | $52,610 | $5,010 | $47,600 |
| 2017 | $4,749 | $50,340 | $4,100 | $46,240 |
| 2016 | $4,723 | $50,340 | $4,100 | $46,240 |
| 2015 | $10,637 | $50,340 | $4,100 | $46,240 |
| 2014 | $4,900 | $50,340 | $4,100 | $46,240 |
Source: Public Records
Map
Nearby Homes
- 3 Fiddle Sticks
- 20 Van Ess Dr
- 16 Van Ess Dr
- 3 Concert Ln
- 11 Concert Ct
- 7224 Pine Woods Way
- VANDERBURGH Plan at Olmsted - Sanctuary of
- LYNDHURST Plan at Olmsted - Sanctuary of
- BELLEVILLE Plan at Olmsted - Sanctuary of
- ALDEN Plan at Olmsted - Sanctuary of
- VALE Plan at Olmsted - Sanctuary of
- BUCHANAN Plan at Olmsted - Sanctuary of
- 11 Brookins Dr
- 55 Patio Ln
- 26915 Eastwood Ln
- 7087 Mackenzie Rd
- 26946 Westwood Ln
- 5 Hawthorn Dr
- 7296 Chestnut Ct
- 6706 Crestwood Ln