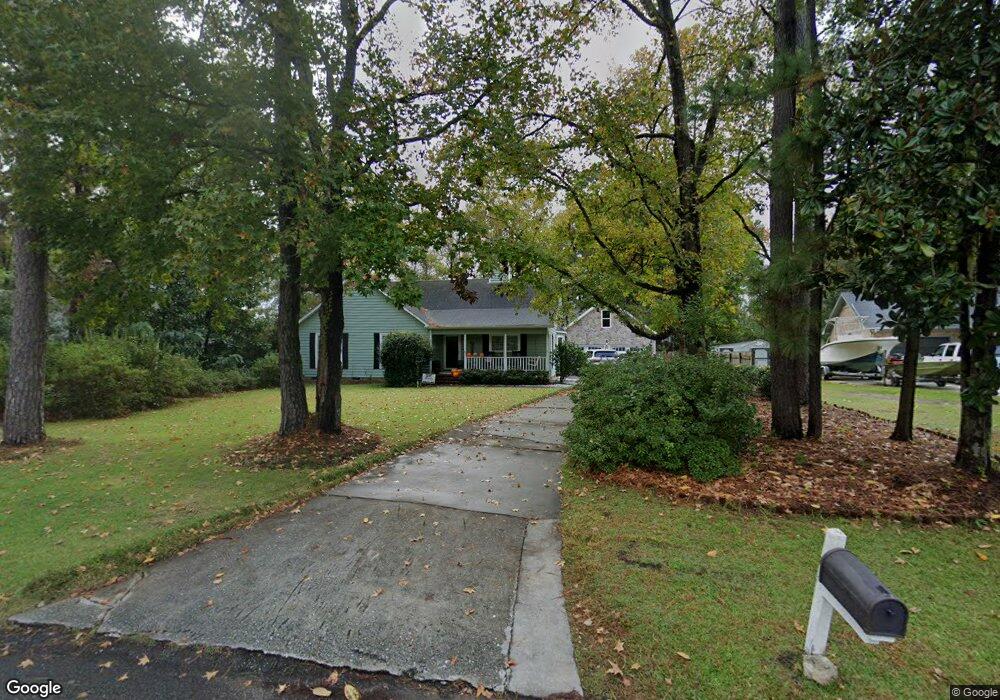
7107 Northbend Rd Wilmington, NC 28411
Estimated Value: $501,697 - $594,000
3
Beds
3
Baths
2,244
Sq Ft
$249/Sq Ft
Est. Value
About This Home
This home is located at 7107 Northbend Rd, Wilmington, NC 28411 and is currently estimated at $558,674, approximately $248 per square foot. 7107 Northbend Rd is a home located in New Hanover County with nearby schools including Ogden Elementary School, M.C.S. Noble Middle School, and Emsley A. Laney High School.
Ownership History
Date
Name
Owned For
Owner Type
Purchase Details
Closed on
Oct 31, 2002
Sold by
Rice Timothy N Susan M
Bought by
Kane Karen
Current Estimated Value
Purchase Details
Closed on
Mar 3, 1999
Sold by
Flores Trinidad Melanie
Bought by
Rice Timothy N Susan M
Purchase Details
Closed on
Sep 15, 1995
Sold by
Swofford Dale M Karen B
Bought by
Flores Trinidad Melanie
Purchase Details
Closed on
Jun 21, 1989
Sold by
Overstreet Hugh Iii Laura
Bought by
Swofford Dale M Karen B
Purchase Details
Closed on
Dec 1, 1988
Sold by
Yunaska Robert L
Bought by
Yunaska Robert L
Purchase Details
Closed on
Jan 1, 1988
Sold by
Leons Home Center Inc
Bought by
Yunaska Robert L
Purchase Details
Closed on
Jun 1, 1985
Sold by
Coble Sr Randolph L
Bought by
Leons Home Center Inc
Purchase Details
Closed on
Jan 1, 1978
Bought by
Coble Randolph L
Create a Home Valuation Report for This Property
The Home Valuation Report is an in-depth analysis detailing your home's value as well as a comparison with similar homes in the area
Home Values in the Area
Average Home Value in this Area
Purchase History
| Date | Buyer | Sale Price | Title Company |
|---|---|---|---|
| Kane Karen | $164,000 | -- | |
| Rice Timothy N Susan M | $156,500 | -- | |
| Flores Trinidad Melanie | $141,500 | -- | |
| Swofford Dale M Karen B | $109,500 | -- | |
| Yunaska Robert L | $15,000 | -- | |
| Yunaska Robert L | $50,000 | -- | |
| Leons Home Center Inc | $165,500 | -- | |
| Coble Randolph L | $4,400 | -- |
Source: Public Records
Tax History Compared to Growth
Tax History
| Year | Tax Paid | Tax Assessment Tax Assessment Total Assessment is a certain percentage of the fair market value that is determined by local assessors to be the total taxable value of land and additions on the property. | Land | Improvement |
|---|---|---|---|---|
| 2025 | $1,848 | $468,800 | $165,400 | $303,400 |
| 2024 | $1,579 | $288,100 | $119,500 | $168,600 |
| 2023 | $1,588 | $288,100 | $119,500 | $168,600 |
| 2022 | $1,588 | $288,100 | $119,500 | $168,600 |
| 2021 | $1,589 | $288,100 | $119,500 | $168,600 |
| 2020 | $1,538 | $243,100 | $62,400 | $180,700 |
| 2019 | $1,538 | $243,100 | $62,400 | $180,700 |
| 2018 | $1,538 | $243,100 | $62,400 | $180,700 |
| 2017 | $1,437 | $222,000 | $62,400 | $159,600 |
| 2016 | $1,619 | $233,600 | $61,800 | $171,800 |
| 2015 | $1,504 | $233,600 | $61,800 | $171,800 |
| 2014 | $1,479 | $233,600 | $61,800 | $171,800 |
Source: Public Records
Map
Nearby Homes
- 7003 Northbend Rd
- 1501 Field View Rd
- 125 Northhills Dr
- 113 Long John Silver Dr
- 935 Baldwin Park Dr
- 802 Anchors Bend Way
- 802 Anchors Bend Way Unit Lot 15
- 804 Anchors Bend Way Unit Lot 14
- 804 Anchors Bend Way
- 806 Anchors Bend Way Unit , 13
- Tilley Plan at Anchors Bend Townes
- Montague Plan at Anchors Bend Townes
- 829 Anchors Bend Way Unit , 21
- 827 Anchors Bend Way
- 823 Anchors Bend Way Unit Lot 18
- 821 Anchors Bend Way Unit , 17
- 808 Anchors Bend Way Unit , 12
- 835 Anchors Bend Way Unit 24
- 832 Anchors Bend Way Unit Lot 4
- 832 Anchors Bend Way Unit 3
- 7107 N Bend Rd
- 7103 Northbend Rd
- 7111 Northbend Rd
- 7108 Northbend Rd
- 4130 Glen Arbor Dr
- 7115 Northbend Rd
- 4134 Glen Arbor Dr
- 7100 Northbend Rd
- 4136 Glen Arbor Dr
- 7119 Northbend Rd
- 1416 Middle Sound Loop Rd
- 4124 Glen Arbor Dr
- 7015 Northbend Rd
- 1508 Middle Sound Loop Rd
- 1512 Middle Sound Loop Rd
- 4122 Glen Arbor Dr
- 4119 Glen Arbor Dr
- 102 Northhills Dr
- 7009 Northbend Rd
- 7012 N Bend Rd