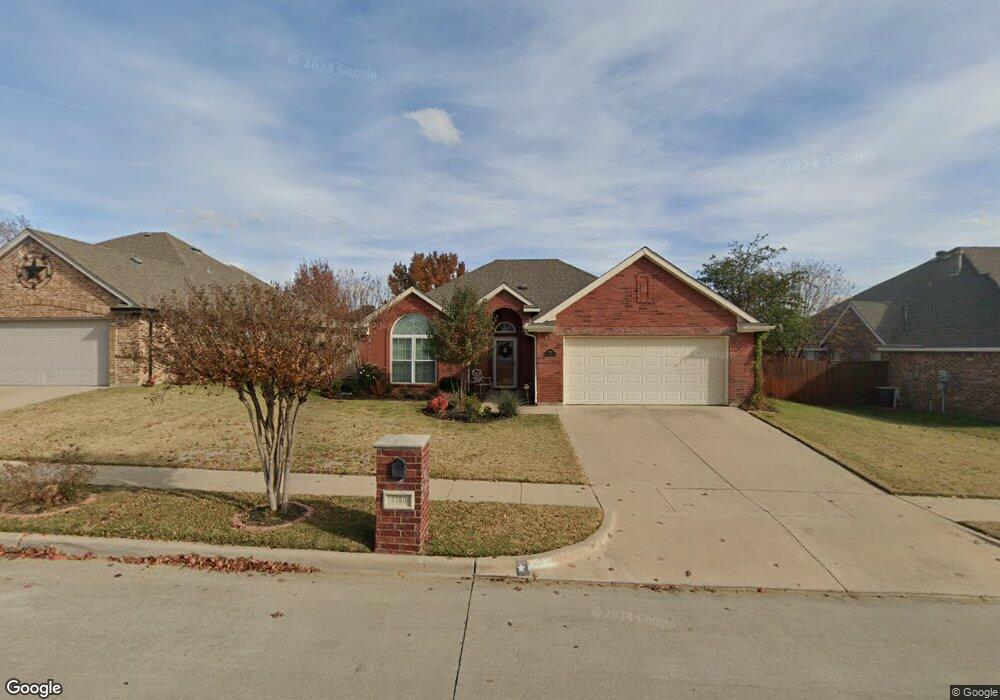
7108 Herman Jared Dr North Richland Hills, TX 76182
Estimated Value: $369,874 - $394,000
3
Beds
2
Baths
1,610
Sq Ft
$238/Sq Ft
Est. Value
About This Home
This home is located at 7108 Herman Jared Dr, North Richland Hills, TX 76182 and is currently estimated at $383,469, approximately $238 per square foot. 7108 Herman Jared Dr is a home located in Tarrant County with nearby schools including Smithfield Elementary School, Smithfield Middle School, and Birdville High School.
Ownership History
Date
Name
Owned For
Owner Type
Purchase Details
Closed on
Jun 20, 2006
Sold by
Thompson Gerry
Bought by
Ezzell Billy F and Ezzell Nettie L
Current Estimated Value
Home Financials for this Owner
Home Financials are based on the most recent Mortgage that was taken out on this home.
Original Mortgage
$50,000
Interest Rate
6.56%
Mortgage Type
Purchase Money Mortgage
Purchase Details
Closed on
Oct 31, 2000
Sold by
Prime Advantage Inc
Bought by
Thompson Gerry
Home Financials for this Owner
Home Financials are based on the most recent Mortgage that was taken out on this home.
Original Mortgage
$120,800
Interest Rate
7.9%
Purchase Details
Closed on
Jul 28, 2000
Sold by
Holigan Homes Texas Ltd
Bought by
Prime Advantage Inc
Home Financials for this Owner
Home Financials are based on the most recent Mortgage that was taken out on this home.
Original Mortgage
$110,400
Interest Rate
8.22%
Create a Home Valuation Report for This Property
The Home Valuation Report is an in-depth analysis detailing your home's value as well as a comparison with similar homes in the area
Home Values in the Area
Average Home Value in this Area
Purchase History
| Date | Buyer | Sale Price | Title Company |
|---|---|---|---|
| Ezzell Billy F | -- | First Land Title | |
| Thompson Gerry | -- | Fidelity National Title Agen | |
| Prime Advantage Inc | -- | Fidelity National Title Agen |
Source: Public Records
Mortgage History
| Date | Status | Borrower | Loan Amount |
|---|---|---|---|
| Closed | Ezzell Billy F | $50,000 | |
| Previous Owner | Thompson Gerry | $120,800 | |
| Previous Owner | Prime Advantage Inc | $110,400 |
Source: Public Records
Tax History Compared to Growth
Tax History
| Year | Tax Paid | Tax Assessment Tax Assessment Total Assessment is a certain percentage of the fair market value that is determined by local assessors to be the total taxable value of land and additions on the property. | Land | Improvement |
|---|---|---|---|---|
| 2025 | $1,390 | $344,842 | $75,000 | $269,842 |
| 2024 | $1,390 | $344,842 | $75,000 | $269,842 |
| 2023 | $6,825 | $360,194 | $75,000 | $285,194 |
| 2022 | $6,806 | $295,932 | $55,000 | $240,932 |
| 2021 | $6,542 | $262,904 | $55,000 | $207,904 |
| 2020 | $5,947 | $233,739 | $55,000 | $178,739 |
| 2019 | $6,178 | $234,591 | $55,000 | $179,591 |
| 2018 | $2,959 | $224,007 | $55,000 | $169,007 |
| 2017 | $5,479 | $210,839 | $55,000 | $155,839 |
| 2016 | $4,981 | $203,365 | $40,000 | $163,365 |
| 2015 | $2,984 | $168,300 | $22,000 | $146,300 |
| 2014 | $2,984 | $168,300 | $22,000 | $146,300 |
Source: Public Records
Map
Nearby Homes
- 8440 Stephanie Dr
- 8412 Timberline Ct
- 6921 Westover Way
- 7104 Melissa Ct
- 7304 Davis Blvd
- 8436 Town Walk Dr
- 8420 Town Walk Dr
- 8966 Hialeah Cir S
- 6971 Cox Ln
- 7317 Hialeah Cir W
- 8220 Odell St
- 8421 Randy Dr
- 8209 Spruce Ct
- 7036 Crabtree Ln
- 9017 Rumfield Rd
- 7321 Fallen Oak Dr
- 7020 Live Oak Dr
- 8409 Glenann Dr
- 8020 Cross Dr
- 6509 Paula Ct
- 7104 Herman Jared Dr
- 7112 Herman Jared Dr
- 7109 Michael Dr
- 7113 Michael Dr
- 7105 Michael Dr
- 7116 Herman Jared Dr
- 7100 Herman Jared Dr
- 7117 Michael Dr
- 7105 Herman Jared Dr
- 7101 Michael Dr
- 7117 Herman Jared Dr
- 7120 Herman Jared Dr
- 7101 Herman Jared Dr
- 7121 Michael Dr
- 8608 Matt Dr
- 7121 Herman Jared Dr
- 7108 Michael Dr
- 7112 Michael Dr
- 7036 Herman Jared Dr
- 7104 Michael Dr