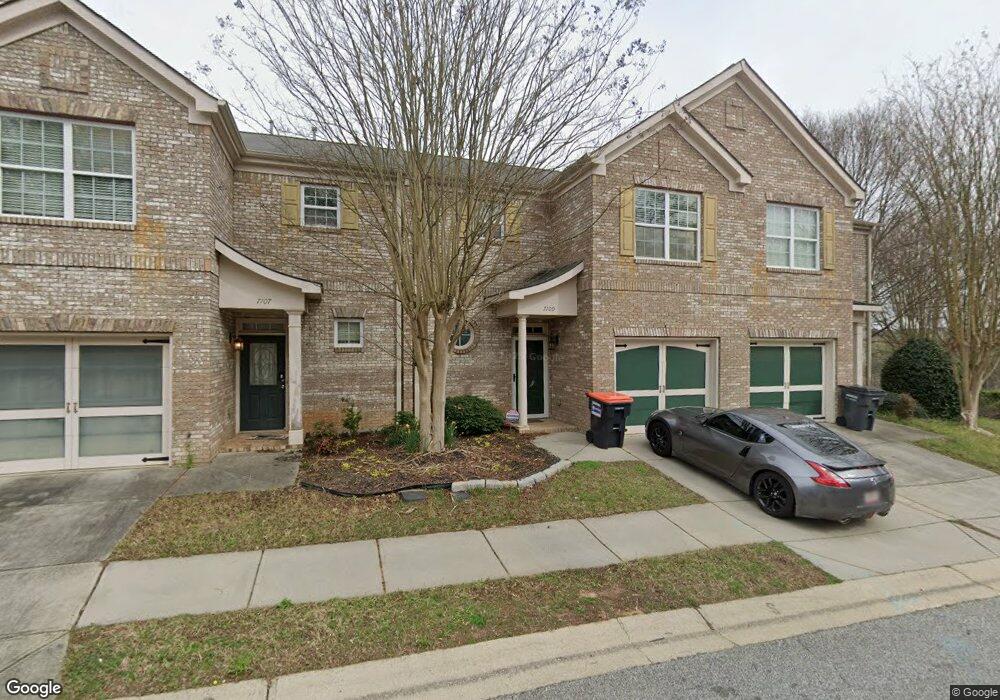
7109 Blairs View Ct Unit 6 Austell, GA 30168
Estimated Value: $240,315 - $253,000
2
Beds
3
Baths
1,680
Sq Ft
$147/Sq Ft
Est. Value
About This Home
This home is located at 7109 Blairs View Ct Unit 6, Austell, GA 30168 and is currently estimated at $246,329, approximately $146 per square foot. 7109 Blairs View Ct Unit 6 is a home located in Cobb County with nearby schools including Bryant Elementary School, Lindley Middle School, and Pebblebrook High School.
Ownership History
Date
Name
Owned For
Owner Type
Purchase Details
Closed on
Jun 12, 2023
Sold by
Reese Regina Y
Bought by
Roehm Kelly
Current Estimated Value
Purchase Details
Closed on
Mar 10, 2017
Sold by
Phillips Annie W
Bought by
Reese Regina Y
Home Financials for this Owner
Home Financials are based on the most recent Mortgage that was taken out on this home.
Original Mortgage
$110,000
Interest Rate
4.17%
Mortgage Type
VA
Purchase Details
Closed on
Apr 13, 2016
Sold by
Furgess Otto
Bought by
Phillips Annie W
Purchase Details
Closed on
Sep 27, 2011
Sold by
Phillips Annie W
Bought by
Furgess Sophrella
Purchase Details
Closed on
Oct 27, 2005
Sold by
Jpj Dev Llc
Bought by
Furgess Sophrella and Phillips Annie
Home Financials for this Owner
Home Financials are based on the most recent Mortgage that was taken out on this home.
Original Mortgage
$152,150
Interest Rate
6.88%
Mortgage Type
New Conventional
Create a Home Valuation Report for This Property
The Home Valuation Report is an in-depth analysis detailing your home's value as well as a comparison with similar homes in the area
Home Values in the Area
Average Home Value in this Area
Purchase History
| Date | Buyer | Sale Price | Title Company |
|---|---|---|---|
| Roehm Kelly | $252,500 | None Listed On Document | |
| Reese Regina Y | $110,000 | -- | |
| Phillips Annie W | -- | -- | |
| Furgess Sophrella | -- | -- | |
| Furgess Sophrella | $152,200 | -- |
Source: Public Records
Mortgage History
| Date | Status | Borrower | Loan Amount |
|---|---|---|---|
| Previous Owner | Reese Regina Y | $110,000 | |
| Previous Owner | Furgess Sophrella | $152,150 |
Source: Public Records
Tax History Compared to Growth
Tax History
| Year | Tax Paid | Tax Assessment Tax Assessment Total Assessment is a certain percentage of the fair market value that is determined by local assessors to be the total taxable value of land and additions on the property. | Land | Improvement |
|---|---|---|---|---|
| 2025 | $2,606 | $95,724 | $14,000 | $81,724 |
| 2024 | $2,590 | $94,904 | $10,000 | $84,904 |
| 2023 | $0 | $94,904 | $10,000 | $84,904 |
| 2022 | $0 | $76,348 | $6,400 | $69,948 |
| 2021 | $0 | $66,640 | $6,400 | $60,240 |
| 2020 | $1,290 | $61,508 | $6,000 | $55,508 |
| 2019 | $1,290 | $42,504 | $4,000 | $38,504 |
| 2018 | $1,290 | $42,504 | $4,000 | $38,504 |
| 2017 | $1,222 | $42,504 | $4,000 | $38,504 |
| 2016 | $383 | $22,212 | $4,000 | $18,212 |
| 2015 | $394 | $22,212 | $4,000 | $18,212 |
| 2014 | $398 | $22,212 | $0 | $0 |
Source: Public Records
Map
Nearby Homes
- 1243 Blairs Pointe Dr Unit 3
- 1163 Park Center Cir
- 1195 Park Center Cir
- 1199 Park Center Cir
- 1211 Ling Way
- 1203 Park Center Cir
- 1186 Park Center Cir
- 1182 Park Center Cir
- Redbud-Townhome Plan at Park Center Pointe - Hometown Series
- Bayberry-Townhome Plan at Park Center Pointe - Hometown Series
- 1311 Park Center Cir
- Wisteria-Townhome Plan at Park Center Pointe - Hometown Series
- 7254 Silverton Trail
- 7067 Pleasant Dr
- 7063 Pleasant Dr
- 7098 Pleasant Dr
- 1395 Ling Dr Unit 2
- 7109 Blairs View Ct
- 7111 Blairs View Ct Unit 6
- 7107 Blairs View Ct Unit 6
- 7105 Blairs View Dr Unit 22
- 7105 Blairs View Ct Unit 22
- 7105 Blairs View Ct Unit 6
- 7105 Blairs View Ct
- 7064 Blairs View Dr Unit 2
- 7064 Blairs View Dr Unit 5
- 7066 Blairs View Dr Unit 5
- 7108 Blairs View Ct Unit 8
- 7112 Blairs View Ct Unit 7
- 7112 Blairs View Ct Unit 28
- 7114 Blairs View Dr Unit C 7
- 7114 Blairs View Ct Unit C 7
- 7114 Blairs View Ct Unit 7
- 7106 Blairs View Dr
- 7106 Blairs View Dr
- 7106 Blairs View Ct Unit 8
- 7106 Blairs View Ct