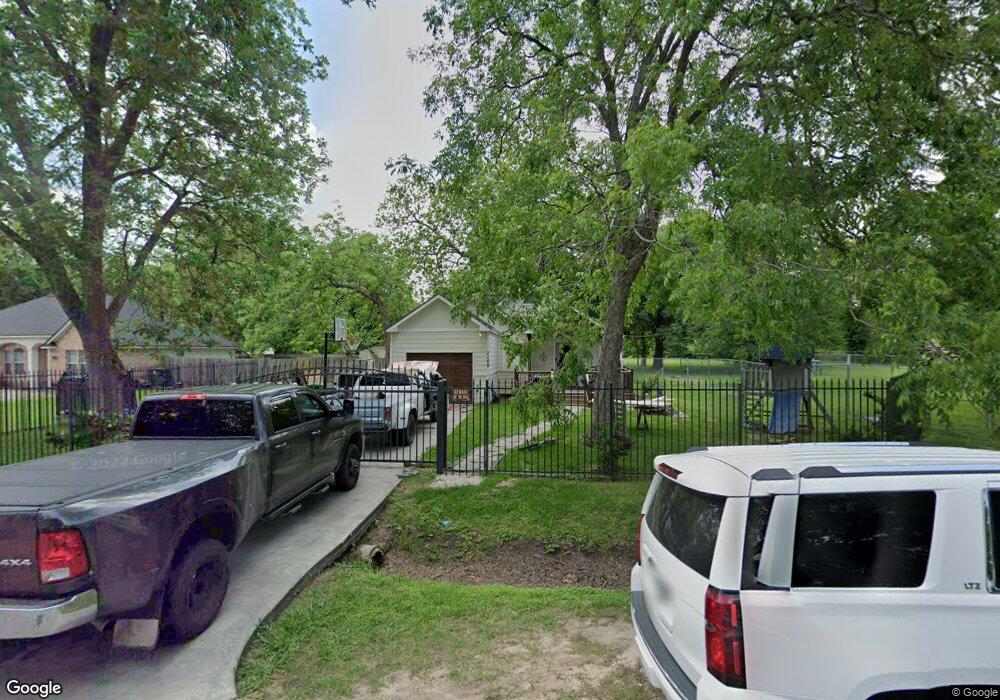
7109 Elbert St Houston, TX 77028
Trinity-Houston Gardens NeighborhoodEstimated Value: $192,000 - $234,000
3
Beds
2
Baths
1,336
Sq Ft
$158/Sq Ft
Est. Value
About This Home
This home is located at 7109 Elbert St, Houston, TX 77028 and is currently estimated at $210,507, approximately $157 per square foot. 7109 Elbert St is a home located in Harris County with nearby schools including McGowen Elementary School, Key Middle, and Kashmere High School.
Ownership History
Date
Name
Owned For
Owner Type
Purchase Details
Closed on
May 28, 2014
Sold by
The Secretary Of Hud
Bought by
Morgan Cecilia Antoinette
Current Estimated Value
Home Financials for this Owner
Home Financials are based on the most recent Mortgage that was taken out on this home.
Original Mortgage
$57,753
Outstanding Balance
$45,009
Interest Rate
4.87%
Mortgage Type
FHA
Estimated Equity
$165,498
Purchase Details
Closed on
Dec 4, 2012
Sold by
Bank Of America Na
Bought by
The Secretary Of Hud Of Washington D C
Purchase Details
Closed on
Nov 6, 2012
Sold by
Porter Monica S and Tabor Douglas
Bought by
Bank Of America N A
Purchase Details
Closed on
Oct 18, 2007
Sold by
Gibbs Washington James I and Gibbs Washington Doris
Bought by
Porter Monica S
Home Financials for this Owner
Home Financials are based on the most recent Mortgage that was taken out on this home.
Original Mortgage
$106,331
Interest Rate
6.32%
Mortgage Type
FHA
Create a Home Valuation Report for This Property
The Home Valuation Report is an in-depth analysis detailing your home's value as well as a comparison with similar homes in the area
Home Values in the Area
Average Home Value in this Area
Purchase History
| Date | Buyer | Sale Price | Title Company |
|---|---|---|---|
| Morgan Cecilia Antoinette | -- | Fidelity National Title | |
| The Secretary Of Hud Of Washington D C | -- | None Available | |
| Bank Of America N A | $128,022 | None Available | |
| Porter Monica S | -- | None Available |
Source: Public Records
Mortgage History
| Date | Status | Borrower | Loan Amount |
|---|---|---|---|
| Open | Morgan Cecilia Antoinette | $57,753 | |
| Previous Owner | Porter Monica S | $106,331 |
Source: Public Records
Tax History Compared to Growth
Tax History
| Year | Tax Paid | Tax Assessment Tax Assessment Total Assessment is a certain percentage of the fair market value that is determined by local assessors to be the total taxable value of land and additions on the property. | Land | Improvement |
|---|---|---|---|---|
| 2025 | $1,221 | $255,871 | $55,572 | $200,299 |
| 2024 | $1,221 | $223,694 | $50,237 | $173,457 |
| 2023 | $1,221 | $176,688 | $44,458 | $132,230 |
| 2022 | $2,263 | $148,604 | $31,120 | $117,484 |
| 2021 | $2,178 | $120,253 | $19,561 | $100,692 |
| 2020 | $2,057 | $120,253 | $19,561 | $100,692 |
| 2019 | $1,954 | $120,253 | $19,561 | $100,692 |
| 2018 | $1,126 | $70,200 | $19,561 | $50,639 |
| 2017 | $1,652 | $70,200 | $19,561 | $50,639 |
| 2016 | $1,502 | $85,532 | $19,561 | $65,971 |
| 2015 | $2,590 | $100,741 | $19,561 | $81,180 |
| 2014 | $2,590 | $100,741 | $19,561 | $81,180 |
Source: Public Records
Map
Nearby Homes
- 7015 Elbert St
- 7123 Saint Louis St
- 0 Kellett St Unit 85066707
- 0 Glen Manor Dr Unit 10745202
- 7505 Jay St
- 0 N Wayside Dr Unit 46613359
- 0 N Wayside Dr Unit 98122285
- 0 N Wayside Dr Unit ACT6956085
- 0 Blue St Unit 50257357
- 6920 Homestead Rd
- 5325 Yarmouth
- 0 N Wayside Dr Unit 54910598
- 0 Balfour Unit 51790448
- 7502 Ley Rd
- 7337 Howton St
- 7306 Saint Louis St
- 6913 Cluett St
- 7204 Homestead Rd
- 0 Belroit St
- 7327 Ley Rd
- 7113 Elbert St
- 7115 Elbert St
- 7101 Elbert St
- 7105 Elbert St
- 7117 Elbert St
- 7414 Banyan St
- 7116 Elbert St
- 7406 Banyan St
- 7415 Banyan St
- 7203 Elbert St
- 7411 Apache St
- 7411 Banyan St
- 7403 Banyan St
- 7403 Banyan St
- 7322 Banyan St
- 7025 Kirkpatrick Blvd
- 7018 Darien St
- 0 Attwater St Unit 64044580
- 0 Bobby Burns St Unit 96404216
- 0 Glen Manor Dr Unit 46256889