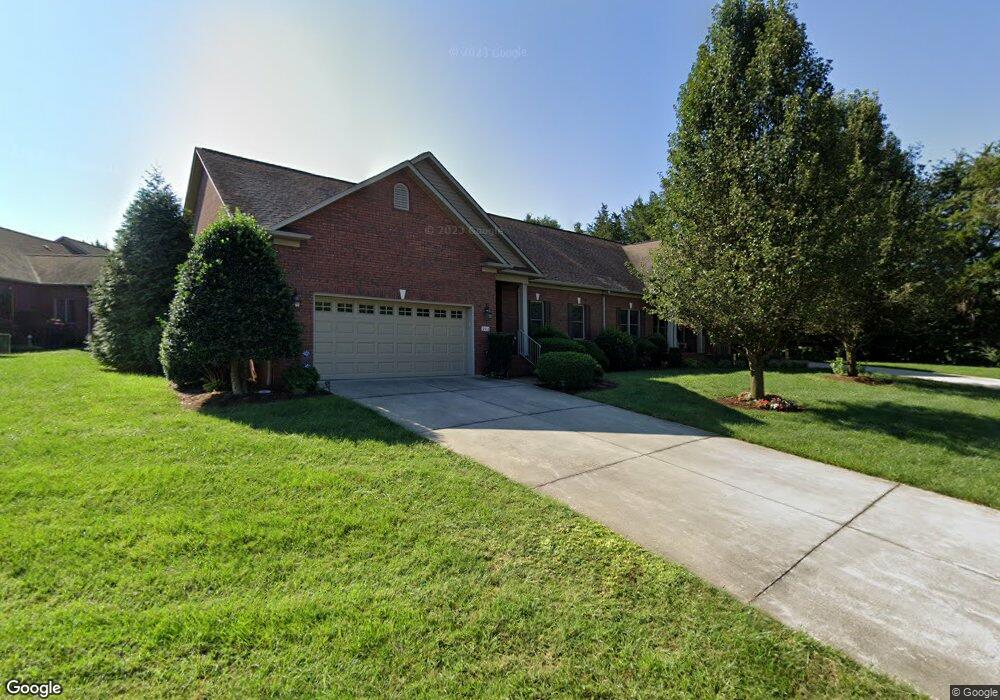
711 3rd St NE Unit E5 Conover, NC 28613
Estimated Value: $356,000 - $389,000
2
Beds
2
Baths
1,852
Sq Ft
$200/Sq Ft
Est. Value
About This Home
This home is located at 711 3rd St NE Unit E5, Conover, NC 28613 and is currently estimated at $370,066, approximately $199 per square foot. 711 3rd St NE Unit E5 is a home located in Catawba County with nearby schools including Shuford Elementary School, Newton-Conover Middle School, and Newton-Conover High School.
Ownership History
Date
Name
Owned For
Owner Type
Purchase Details
Closed on
Mar 9, 2020
Sold by
Downing Repass Kathy V and Repass Dennis
Bought by
Buff Judy
Current Estimated Value
Purchase Details
Closed on
Jul 31, 2013
Sold by
Abernethy Scottie R and Abernethy Alise C
Bought by
Downing Repass Kathy Victoria
Home Financials for this Owner
Home Financials are based on the most recent Mortgage that was taken out on this home.
Original Mortgage
$163,000
Interest Rate
3.96%
Mortgage Type
New Conventional
Purchase Details
Closed on
Dec 22, 2009
Sold by
Paint Masters & Company Inc
Bought by
Abernethy Scottie R and Abernethy Alise C
Purchase Details
Closed on
Jun 4, 2009
Sold by
Dehart Enterprises Inc
Bought by
Nc Builders Associates Inc
Create a Home Valuation Report for This Property
The Home Valuation Report is an in-depth analysis detailing your home's value as well as a comparison with similar homes in the area
Home Values in the Area
Average Home Value in this Area
Purchase History
| Date | Buyer | Sale Price | Title Company |
|---|---|---|---|
| Buff Judy | $258,000 | None Available | |
| Downing Repass Kathy Victoria | $206,000 | None Available | |
| Abernethy Scottie R | $220,000 | None Available | |
| Nc Builders Associates Inc | $460,000 | None Available |
Source: Public Records
Mortgage History
| Date | Status | Borrower | Loan Amount |
|---|---|---|---|
| Previous Owner | Downing Repass Kathy Victoria | $163,000 |
Source: Public Records
Tax History
| Year | Tax Paid | Tax Assessment Tax Assessment Total Assessment is a certain percentage of the fair market value that is determined by local assessors to be the total taxable value of land and additions on the property. | Land | Improvement |
|---|---|---|---|---|
| 2025 | $2,602 | $327,900 | $29,000 | $298,900 |
| 2024 | $2,602 | $327,900 | $29,000 | $298,900 |
| 2023 | $2,602 | $327,900 | $29,000 | $298,900 |
| 2022 | $2,576 | $239,600 | $20,000 | $219,600 |
| 2021 | $2,576 | $239,600 | $20,000 | $219,600 |
| 2020 | $2,576 | $239,600 | $20,000 | $219,600 |
| 2019 | $2,576 | $239,600 | $0 | $0 |
| 2018 | $2,292 | $213,200 | $20,000 | $193,200 |
| 2017 | $2,228 | $0 | $0 | $0 |
| 2016 | $2,228 | $0 | $0 | $0 |
| 2015 | $1,977 | $213,170 | $20,000 | $193,170 |
| 2014 | $1,977 | $212,600 | $20,000 | $192,600 |
Source: Public Records
Map
Nearby Homes
- 406 Rock Barn Rd NE
- 906 4th St NE
- 811 4th St NE
- 1002 4th St NE
- 905 Conover Blvd E
- 505 2nd Street Place NE Unit D2
- 505 2nd Street Place NE Unit B2
- 918 Emmanuel Church Rd
- 503 5th Ave NE
- 408 Mooreland Dr NE
- 103 Mooreland Dr NE
- 510 4th Ave NE
- 510 7th St NE
- 611 5th Ave NE Unit PT21&22/L
- 404 Thornburg Dr NE
- 203 3rd Ave NE
- 701 3rd St SE
- 507 7th St NE Unit 29
- 710 4th Ave NE
- 304 Parlier Ave NE
- 711 3rd St NE
- 709 3rd St NE
- 309 8th Ave NE Unit E-4
- 309 8th Ave NE
- 307 8th Ave NE Unit E-3
- 307 8th Ave NE
- 305 8th Ave NE Unit E2
- 305 8th Ave NE
- 712 3rd St NE
- 303 8th Ave NE
- 710 3rd St NE
- 313 8th Ave NE
- 708 3rd St NE Unit E-8
- 708 3rd St NE
- 706 3rd St NE
- 706 3rd St NE
- 315 8th Ave NE
- 803 3rd St NE
- 802 3rd Street Dr NE
- 317 8th Ave NE
Your Personal Tour Guide
Ask me questions while you tour the home.