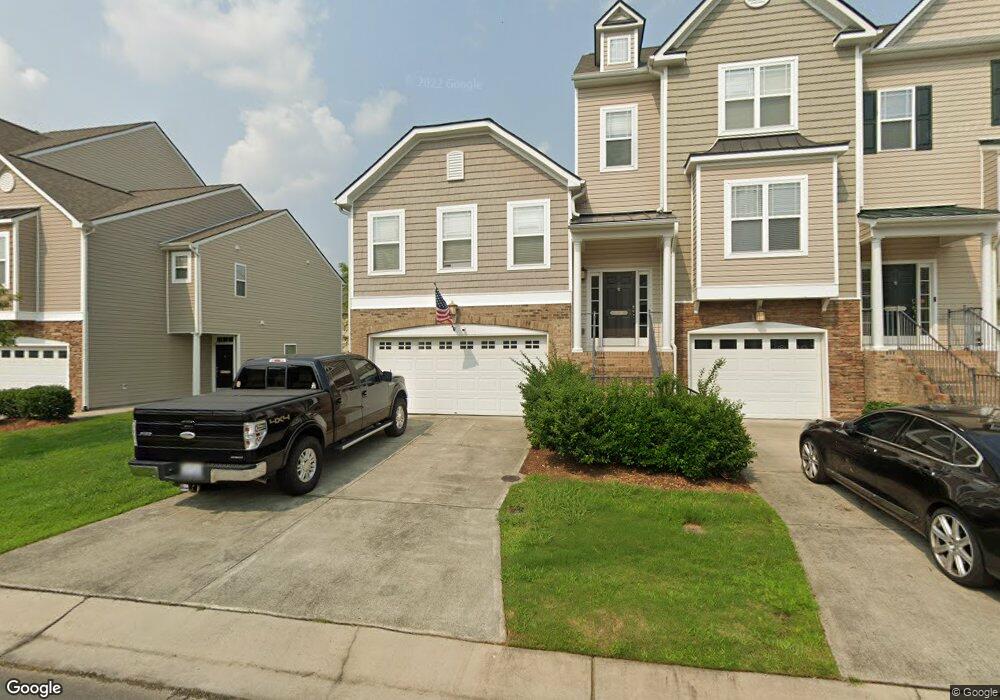
711-57 Keystone Park Dr Unit 57 Morrisville, NC 27560
Estimated Value: $328,000 - $343,000
3
Beds
3
Baths
1,600
Sq Ft
$211/Sq Ft
Est. Value
About This Home
This home is located at 711-57 Keystone Park Dr Unit 57, Morrisville, NC 27560 and is currently estimated at $337,962, approximately $211 per square foot. 711-57 Keystone Park Dr Unit 57 is a home located in Durham County with nearby schools including Parkwood Elementary, Lowe's Grove Middle, and Hillside High School.
Ownership History
Date
Name
Owned For
Owner Type
Purchase Details
Closed on
Apr 23, 2020
Sold by
Beddoe Gabrielle Micheline
Bought by
Christensen Tyson K
Current Estimated Value
Home Financials for this Owner
Home Financials are based on the most recent Mortgage that was taken out on this home.
Original Mortgage
$248,640
Outstanding Balance
$219,847
Interest Rate
3.3%
Mortgage Type
VA
Estimated Equity
$118,116
Purchase Details
Closed on
Jul 1, 2010
Sold by
Keystone Crossing Townhomes Llc
Bought by
Beddoe Gabrielle Micheline
Home Financials for this Owner
Home Financials are based on the most recent Mortgage that was taken out on this home.
Original Mortgage
$132,000
Interest Rate
4.79%
Mortgage Type
New Conventional
Purchase Details
Closed on
Aug 14, 2009
Sold by
Anderson Homes Inc
Bought by
Keystone Crossing Llc
Create a Home Valuation Report for This Property
The Home Valuation Report is an in-depth analysis detailing your home's value as well as a comparison with similar homes in the area
Home Values in the Area
Average Home Value in this Area
Purchase History
| Date | Buyer | Sale Price | Title Company |
|---|---|---|---|
| Christensen Tyson K | $240,000 | None Available | |
| Beddoe Gabrielle Micheline | $165,500 | None Available | |
| Keystone Crossing Llc | $152,000 | None Available |
Source: Public Records
Mortgage History
| Date | Status | Borrower | Loan Amount |
|---|---|---|---|
| Open | Christensen Tyson K | $248,640 | |
| Previous Owner | Beddoe Gabrielle Micheline | $132,000 |
Source: Public Records
Tax History Compared to Growth
Tax History
| Year | Tax Paid | Tax Assessment Tax Assessment Total Assessment is a certain percentage of the fair market value that is determined by local assessors to be the total taxable value of land and additions on the property. | Land | Improvement |
|---|---|---|---|---|
| 2025 | $2,900 | $376,544 | $80,000 | $296,544 |
| 2024 | $2,900 | $207,886 | $40,000 | $167,886 |
| 2023 | $2,723 | $207,886 | $40,000 | $167,886 |
| 2022 | $2,661 | $207,886 | $40,000 | $167,886 |
| 2021 | $2,648 | $207,886 | $40,000 | $167,886 |
| 2020 | $2,586 | $207,886 | $40,000 | $167,886 |
| 2019 | $2,586 | $207,886 | $40,000 | $167,886 |
| 2018 | $2,384 | $175,714 | $32,000 | $143,714 |
| 2017 | $2,366 | $175,714 | $32,000 | $143,714 |
| 2016 | $2,286 | $175,714 | $32,000 | $143,714 |
| 2015 | $2,509 | $181,272 | $34,100 | $147,172 |
| 2014 | $2,509 | $181,272 | $34,100 | $147,172 |
Source: Public Records
Map
Nearby Homes
- 732 Keystone Park Dr
- 104 Mainline Station
- 4804 Trolley Ct
- 5780 S Miami Blvd
- 1028 Brennan Green Ct
- 2949 Historic Cir
- 1004 Governess Ln
- 1144 Survada Ln
- 1148 Survada Ln
- 1116 Crinoline Ln
- 1025 Historic Cir
- 2129 Glade Valley Ln
- 1404 Legendary Ln
- 2122 Aventon Ln
- 2036 Aventon Ln
- 4511 Hopson Rd
- 4503 Hopson Rd
- 508 Durants Neck Ln
- 113 Lafferty St
- 1519 Chesterfield Ln
- 711-57 Keystone Park Dr Unit 250
- 705 Keystone Park Dr
- 711.48 Keystone Park Dr
- 711-53 Keystone Park Dr
- 711-51 Keystone Park Dr
- 711-61 Keystone Park Dr Unit 248
- 711-59 Keystone Park Dr Unit 249
- 711-37 Keystone Park Dr
- 705 Keystone Park Dr
- 705-74 Keystone Park Dr Unit 315
- 705-74 Keystone Park Dr
- 705-56 Keystone Park Dr
- 705-56 Keystone Park Dr Unit 56
- 711 Keystone Park Dr
- 711-46 Keystone Park Unit 46
- 705-65 Keystone Park Unit 65
- 705 Keystone Park Dr
- 705 Keystone Park Dr
- 705-73 Keystone Park Dr
- 705 Keystone Park Dr