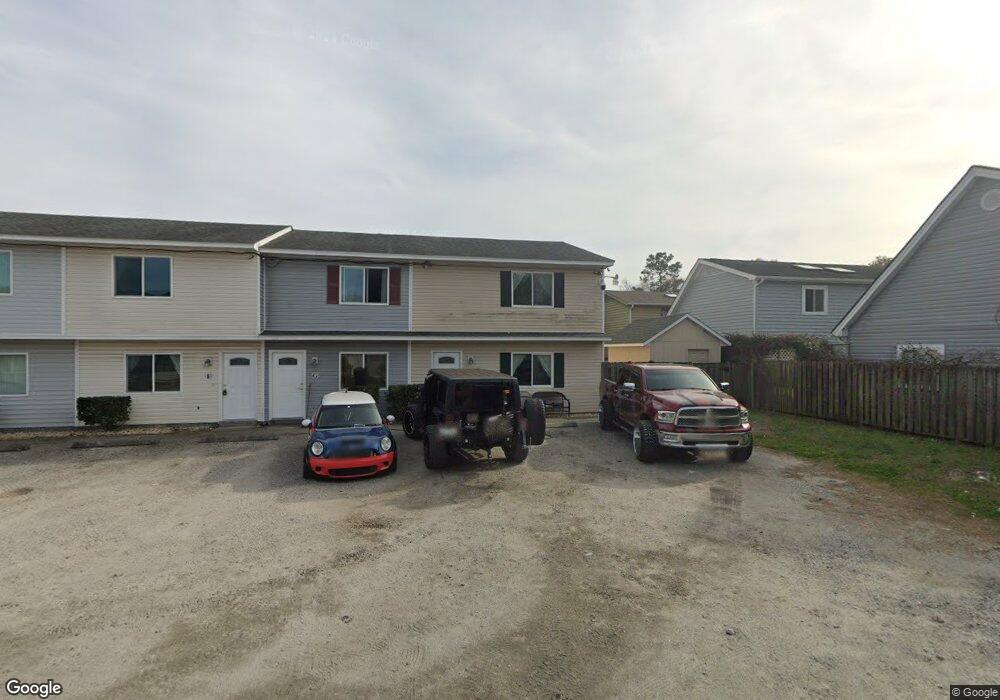
711 67th Ave N Unit A Myrtle Beach, SC 29572
Grande Dunes NeighborhoodEstimated Value: $140,000 - $850,000
3
Beds
3
Baths
1,200
Sq Ft
$356/Sq Ft
Est. Value
About This Home
This home is located at 711 67th Ave N Unit A, Myrtle Beach, SC 29572 and is currently estimated at $427,364, approximately $356 per square foot. 711 67th Ave N Unit A is a home located in Horry County with nearby schools including Myrtle Beach Child Development Center, Myrtle Beach Elementary School, and Myrtle Beach Primary School.
Ownership History
Date
Name
Owned For
Owner Type
Purchase Details
Closed on
Apr 29, 2025
Sold by
Papadogiannis Christos
Bought by
Grc Properties Llc
Current Estimated Value
Purchase Details
Closed on
Aug 27, 2024
Sold by
Append Investments Llc
Bought by
Papadogiannis Christos
Purchase Details
Closed on
Mar 7, 2024
Sold by
Guaranty Holdings Of California Inc
Bought by
Append Investments Llc
Purchase Details
Closed on
Mar 9, 2022
Sold by
Jamke
Bought by
Guaranty Holdings Of California Inc
Purchase Details
Closed on
Dec 17, 2021
Sold by
Kulback Kenneth J
Bought by
Jamke
Purchase Details
Closed on
Apr 5, 2012
Sold by
Paramount Llc
Bought by
Kulback Kenneth J
Purchase Details
Closed on
Dec 21, 2011
Sold by
H M Booke Llc
Bought by
Paramount Llc
Purchase Details
Closed on
Aug 3, 2001
Sold by
Ocean View Ventures Inc
Bought by
Hb Properties Inc
Purchase Details
Closed on
Oct 7, 1999
Sold by
Flowers Gary E
Bought by
Ocean View Ventures Inc
Create a Home Valuation Report for This Property
The Home Valuation Report is an in-depth analysis detailing your home's value as well as a comparison with similar homes in the area
Home Values in the Area
Average Home Value in this Area
Purchase History
| Date | Buyer | Sale Price | Title Company |
|---|---|---|---|
| Grc Properties Llc | $1,050,000 | -- | |
| Papadogiannis Christos | $900,000 | -- | |
| Append Investments Llc | $900,000 | -- | |
| Guaranty Holdings Of California Inc | $885,000 | -- | |
| Jamke | $880,000 | -- | |
| Kulback Kenneth J | $300,000 | -- | |
| Paramount Llc | $245,000 | -- | |
| Hb Properties Inc | $401,000 | -- | |
| Ocean View Ventures Inc | $350,000 | -- |
Source: Public Records
Tax History Compared to Growth
Tax History
| Year | Tax Paid | Tax Assessment Tax Assessment Total Assessment is a certain percentage of the fair market value that is determined by local assessors to be the total taxable value of land and additions on the property. | Land | Improvement |
|---|---|---|---|---|
| 2024 | $2,780 | $10,921 | $6,000 | $4,921 |
| 2023 | $2,780 | $3,108 | $576 | $2,532 |
| 2021 | $2,067 | $3,108 | $576 | $2,532 |
| 2020 | $801 | $3,108 | $576 | $2,532 |
| 2019 | $801 | $3,108 | $576 | $2,532 |
| 2018 | $0 | $2,754 | $576 | $2,178 |
| 2017 | $723 | $2,754 | $576 | $2,178 |
| 2016 | -- | $2,754 | $576 | $2,178 |
| 2015 | $715 | $2,754 | $576 | $2,178 |
| 2014 | $695 | $2,754 | $576 | $2,178 |
Source: Public Records
Map
Nearby Homes
- 6619 Colonial Dr
- 712 67th Ave N Unit 2A
- 712 67th Ave N Unit 1E
- 6703 Jefferson Place Unit B1
- 6703 Jefferson Place Unit B-2
- 843 67th Ave N
- TBD Bryant St. Bryant St Unit BRYANT DR; PARCEL 2-
- 6702 Jefferson Place Unit F2
- 6702 Jefferson Place Unit C3
- 6702 Jefferson Place Unit B6
- 6702 Jefferson Place Unit C6
- 6706 Bryant St Unit C
- 6703 Bryant St Unit A
- 6703 Bryant St
- 6708 Bryant St Unit E
- TBD 67th Ave N
- 6624 Lagoon Place
- 6774 Montgomery Ln
- 600 65th Ave N Unit 7
- 6306 Somerset Dr
- 711 67th Ave N Unit H
- 711 67th Ave N Unit A
- 711 67th Ave N Unit G
- 711 67th Ave N Unit F
- 711 67th Ave N Unit E
- 711 67th Ave N Unit D
- 711 67th Ave N Unit C
- 711 67th Ave N Unit B
- 711 67th Ave N Unit s A-H
- 711 67th Ave N Unit E
- 711 67th Ave N Unit G
- 711 67th Ave N Unit AH
- 711 67th Ave N Unit E
- 711 67th Ave N Unit D
- 711 67th Ave N Unit C
- 711 67th Ave N Unit B
- 6515 Valene Ct
- 709 67th Ave N
- 709 67th Ave N Unit H
- 709 67th Ave N