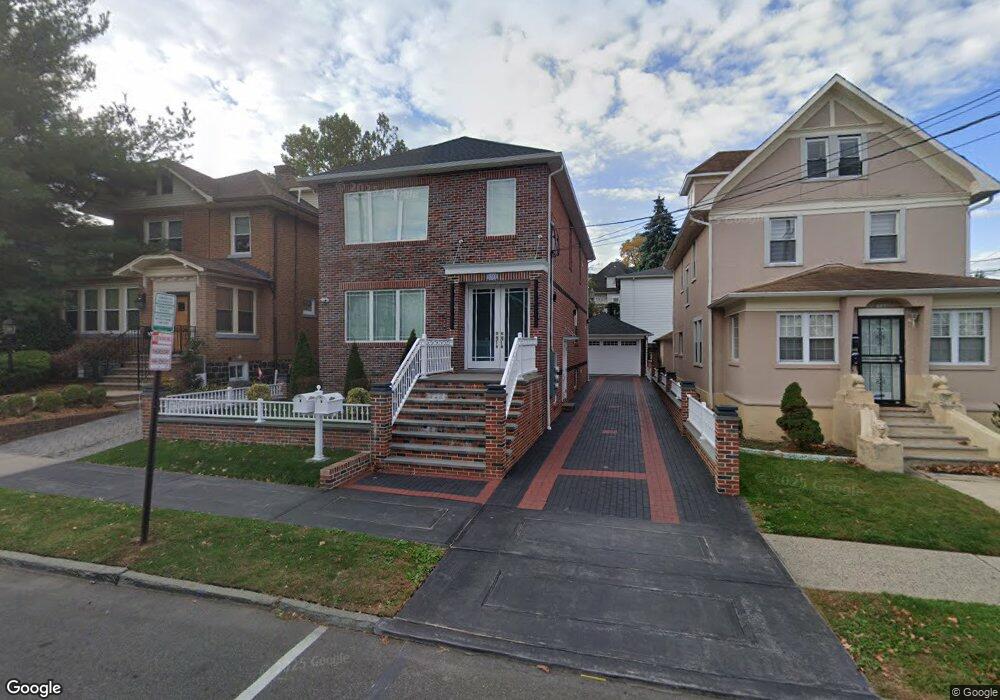
711 79th St North Bergen, NJ 07047
Estimated Value: $837,000 - $996,000
--
Bed
--
Bath
2,268
Sq Ft
$402/Sq Ft
Est. Value
About This Home
This home is located at 711 79th St, North Bergen, NJ 07047 and is currently estimated at $912,649, approximately $402 per square foot. 711 79th St is a home located in Hudson County with nearby schools including North Bergen High School and St. Joseph of the Palisades Elementary School.
Ownership History
Date
Name
Owned For
Owner Type
Purchase Details
Closed on
Apr 13, 2022
Sold by
Bello-Lopez Olga and Ruiz Paula O
Bought by
Aparicio Ariel and Pacheco Raisa
Current Estimated Value
Purchase Details
Closed on
Apr 1, 2011
Sold by
Bello Pedro and Bello Eloina
Bought by
Bello Lopez Olga and Ruiz Paula O
Purchase Details
Closed on
Oct 21, 1997
Sold by
Cabanas Jose E and Cabanas Maria Del Carmen
Bought by
Bello Pedro and Bello Eloina
Home Financials for this Owner
Home Financials are based on the most recent Mortgage that was taken out on this home.
Original Mortgage
$135,000
Interest Rate
7.23%
Purchase Details
Closed on
Apr 7, 1994
Sold by
Alvarez Lucia
Bought by
Cabanas Jose and Cabanas Maria
Home Financials for this Owner
Home Financials are based on the most recent Mortgage that was taken out on this home.
Original Mortgage
$160,000
Interest Rate
7.27%
Create a Home Valuation Report for This Property
The Home Valuation Report is an in-depth analysis detailing your home's value as well as a comparison with similar homes in the area
Home Values in the Area
Average Home Value in this Area
Purchase History
| Date | Buyer | Sale Price | Title Company |
|---|---|---|---|
| Aparicio Ariel | $725,000 | None Listed On Document | |
| Bello Lopez Olga | -- | -- | |
| Bello Pedro | $210,000 | -- | |
| Cabanas Jose | $185,000 | -- |
Source: Public Records
Mortgage History
| Date | Status | Borrower | Loan Amount |
|---|---|---|---|
| Previous Owner | Bello Pedro | $135,000 | |
| Previous Owner | Cabanas Jose | $160,000 |
Source: Public Records
Tax History Compared to Growth
Tax History
| Year | Tax Paid | Tax Assessment Tax Assessment Total Assessment is a certain percentage of the fair market value that is determined by local assessors to be the total taxable value of land and additions on the property. | Land | Improvement |
|---|---|---|---|---|
| 2025 | $14,205 | $813,100 | $355,000 | $458,100 |
| 2024 | $13,237 | $813,100 | $355,000 | $458,100 |
| 2023 | $13,237 | $813,100 | $355,000 | $458,100 |
| 2022 | $11,383 | $720,900 | $355,000 | $365,900 |
| 2021 | $11,384 | $194,500 | $91,000 | $103,500 |
| 2020 | $11,149 | $194,500 | $91,000 | $103,500 |
| 2019 | $11,137 | $194,500 | $91,000 | $103,500 |
| 2018 | $10,962 | $194,500 | $91,000 | $103,500 |
| 2017 | $10,758 | $194,500 | $91,000 | $103,500 |
| 2016 | $10,633 | $194,500 | $91,000 | $103,500 |
| 2015 | $10,291 | $194,500 | $91,000 | $103,500 |
| 2014 | $10,192 | $192,200 | $91,000 | $101,200 |
Source: Public Records
Map
Nearby Homes
- 7603 1st Ave Unit B2
- 509 81st St
- 435 79th St Unit 51
- 8109 4th Ave
- 8111 5th Ave
- 414 78th St
- 7701 Smith Ave
- 1002 74th St
- 7430 John F. Kennedy Blvd Unit 403
- 1214 79th St
- 8222 Kennedy Blvd
- 8305 Bergenline Ave Unit 201
- 711 74th St
- 410 76th St
- 1100 83rd St Unit C1
- 413 76th St
- 331 79th St Unit 31
- 331 79th St Unit 33