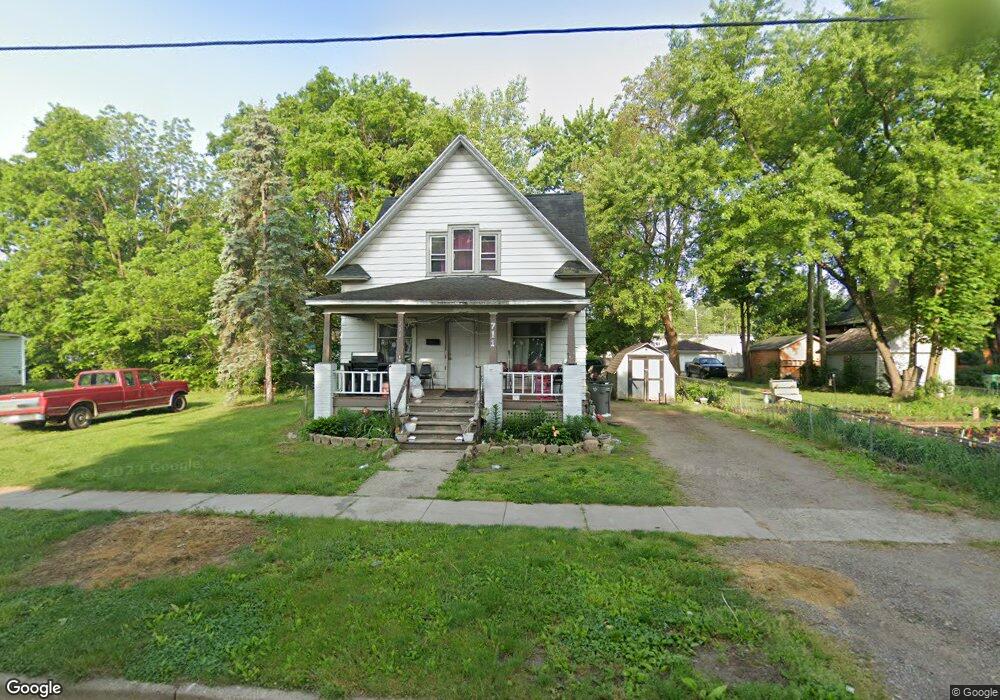
711 7th St Three Rivers, MI 49093
Estimated Value: $82,938 - $142,000
4
Beds
2
Baths
1,800
Sq Ft
$63/Sq Ft
Est. Value
About This Home
This home is located at 711 7th St, Three Rivers, MI 49093 and is currently estimated at $113,235, approximately $62 per square foot. 711 7th St is a home located in St. Joseph County with nearby schools including Immaculate Conception School and Heartwood Renaissance Academy.
Ownership History
Date
Name
Owned For
Owner Type
Purchase Details
Closed on
Sep 29, 2025
Sold by
Schwartz Henry V and Schwartz Kendra E
Bought by
Alvarez Jose Jurado
Current Estimated Value
Home Financials for this Owner
Home Financials are based on the most recent Mortgage that was taken out on this home.
Original Mortgage
$20,000
Outstanding Balance
$20,000
Interest Rate
6.58%
Mortgage Type
New Conventional
Estimated Equity
$93,235
Purchase Details
Closed on
Jul 20, 2007
Sold by
Bent Alexander L and Bent Tracy A
Bought by
The Bank Of New York Trust Co Na and Jp Morgan Chase Bank Na
Purchase Details
Closed on
Sep 24, 2001
Sold by
Zorfas Robert W and Zorfas Patricia M
Bought by
Bent Alexander L and Bent Tracy A
Purchase Details
Closed on
May 14, 1982
Sold by
Farmers Home Administration
Bought by
Zorfas Robert W and Zorfas Patricia M
Create a Home Valuation Report for This Property
The Home Valuation Report is an in-depth analysis detailing your home's value as well as a comparison with similar homes in the area
Home Values in the Area
Average Home Value in this Area
Purchase History
| Date | Buyer | Sale Price | Title Company |
|---|---|---|---|
| Alvarez Jose Jurado | $69,000 | None Listed On Document | |
| The Bank Of New York Trust Co Na | -- | E Title Agency | |
| Bent Alexander L | $38,800 | -- | |
| Zorfas Robert W | $9,500 | -- |
Source: Public Records
Mortgage History
| Date | Status | Borrower | Loan Amount |
|---|---|---|---|
| Open | Alvarez Jose Jurado | $20,000 |
Source: Public Records
Tax History
| Year | Tax Paid | Tax Assessment Tax Assessment Total Assessment is a certain percentage of the fair market value that is determined by local assessors to be the total taxable value of land and additions on the property. | Land | Improvement |
|---|---|---|---|---|
| 2025 | $1,477 | $47,000 | $3,400 | $43,600 |
| 2024 | $1,434 | $40,600 | $2,200 | $38,400 |
| 2023 | $1,367 | $35,000 | $2,300 | $32,700 |
| 2022 | $828 | $30,400 | $2,300 | $28,100 |
| 2021 | $1,308 | $28,900 | $2,300 | $26,600 |
| 2020 | $1,291 | $25,700 | $2,100 | $23,600 |
| 2019 | $1,368 | $23,300 | $1,800 | $21,500 |
| 2018 | $1,213 | $22,000 | $3,700 | $18,300 |
| 2017 | $2,320 | $20,700 | $20,700 | $0 |
| 2016 | -- | $20,500 | $20,500 | $0 |
| 2015 | -- | $20,300 | $0 | $0 |
| 2014 | -- | $21,400 | $21,400 | $0 |
| 2012 | -- | $21,400 | $21,400 | $0 |
Source: Public Records
Map
Nearby Homes
Your Personal Tour Guide
Ask me questions while you tour the home.