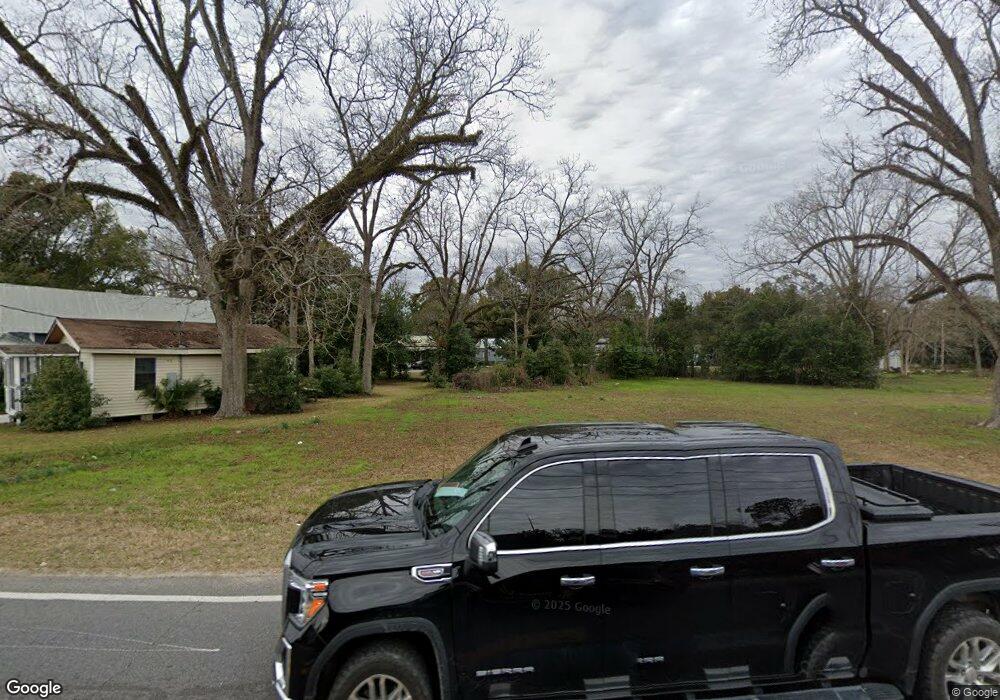
711 Albany Rd Bainbridge, GA 39817
Estimated Value: $175,000 - $295,000
--
Bed
1
Bath
694
Sq Ft
$327/Sq Ft
Est. Value
About This Home
This home is located at 711 Albany Rd, Bainbridge, GA 39817 and is currently estimated at $226,667, approximately $326 per square foot. 711 Albany Rd is a home located in Decatur County with nearby schools including Bainbridge High School and Grace Christian Academy.
Create a Home Valuation Report for This Property
The Home Valuation Report is an in-depth analysis detailing your home's value as well as a comparison with similar homes in the area
Home Values in the Area
Average Home Value in this Area
Tax History Compared to Growth
Tax History
| Year | Tax Paid | Tax Assessment Tax Assessment Total Assessment is a certain percentage of the fair market value that is determined by local assessors to be the total taxable value of land and additions on the property. | Land | Improvement |
|---|---|---|---|---|
| 2024 | $62 | $1,962 | $1,962 | $0 |
| 2023 | $62 | $1,962 | $1,962 | $0 |
| 2022 | $162 | $5,250 | $1,962 | $3,288 |
| 2021 | $151 | $4,754 | $1,962 | $2,792 |
| 2020 | $145 | $4,338 | $1,962 | $2,376 |
| 2019 | $147 | $4,226 | $1,962 | $2,264 |
| 2018 | $145 | $4,226 | $1,962 | $2,264 |
| 2017 | $140 | $4,014 | $1,956 | $2,058 |
| 2016 | $140 | $4,014 | $1,956 | $2,058 |
| 2015 | $144 | $4,014 | $1,956 | $2,058 |
| 2014 | $134 | $4,014 | $1,956 | $2,058 |
| 2013 | -- | $4,013 | $1,955 | $2,058 |
Source: Public Records
Map
Nearby Homes
- 836 Cooper St
- 411 Independent St
- 705 N Lamar St
- 502 Planter St
- 927 5th Ave
- 435 E Broughton St
- 418 E Broughton St
- 302 E Water St
- Dell Rd
- 1020 E Water St
- 640 E Shotwell St
- 632 E Shotwell St
- 423 E Shotwell St
- 906 E Sharpe St
- 249 Meredith Dr
- 245 Meredith Dr
- Lot 3 Mountain View Way
- 0000 Mountain View Way
- Lot 8 Mountain View Way
- 1204 E Water St