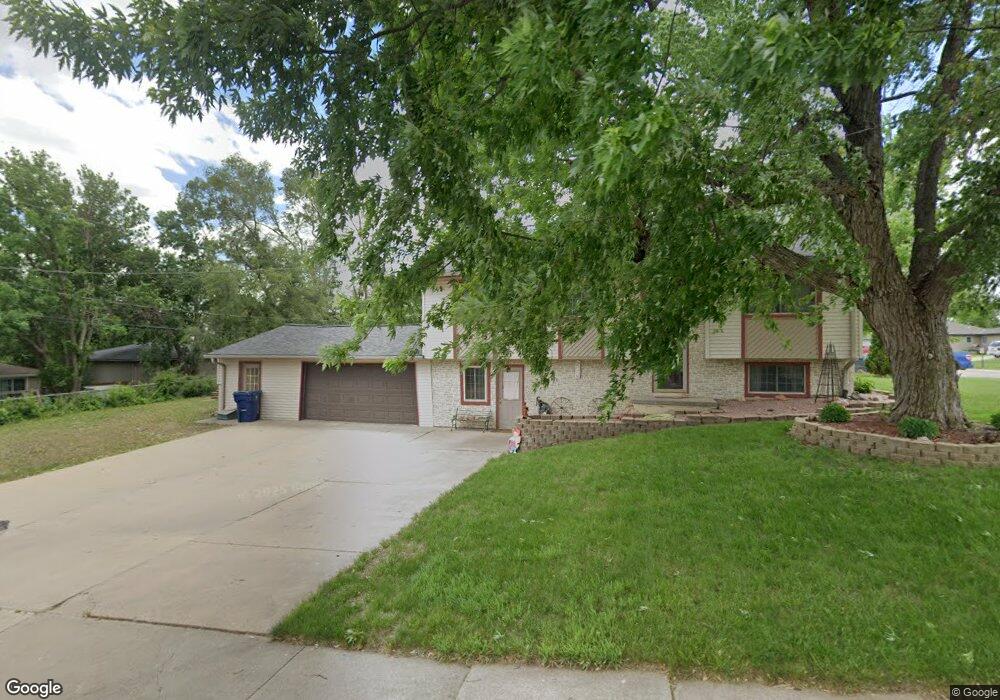
711 Beech St Ceresco, NE 68017
Estimated Value: $245,000 - $275,000
3
Beds
2
Baths
1,026
Sq Ft
$253/Sq Ft
Est. Value
About This Home
This home is located at 711 Beech St, Ceresco, NE 68017 and is currently estimated at $259,916, approximately $253 per square foot. 711 Beech St is a home located in Saunders County with nearby schools including Raymond Central High School.
Ownership History
Date
Name
Owned For
Owner Type
Purchase Details
Closed on
Nov 19, 2020
Sold by
Simanek Christopher W and Simanek Joann K
Bought by
Boller Brian K and Boller Debra L
Current Estimated Value
Purchase Details
Closed on
Aug 26, 2020
Sold by
Simanek Christopher W and Simanek Joann K
Bought by
Simanek Christopher W and Simanek Joann K
Purchase Details
Closed on
Oct 8, 2014
Sold by
Brian Michael Brian Michael and Hendrickson Michelle L
Bought by
Boller Brian and Boller Debra
Purchase Details
Closed on
May 19, 2011
Sold by
Ball Real Estate Co
Bought by
Hendrickson Brian Michael
Purchase Details
Closed on
May 12, 2011
Sold by
Ball Real Estate Co
Bought by
Hendrickson Brian Michael
Purchase Details
Closed on
Apr 5, 2011
Sold by
Sanders Dale B and Sanders Donna E
Bought by
Ball Real Estate Co
Purchase Details
Closed on
Mar 30, 2011
Sold by
Sanders Dale B and Sanders Donna E
Bought by
Ball Real Estate Co
Create a Home Valuation Report for This Property
The Home Valuation Report is an in-depth analysis detailing your home's value as well as a comparison with similar homes in the area
Purchase History
| Date | Buyer | Sale Price | Title Company |
|---|---|---|---|
| Boller Brian K | $61,000 | None Available | |
| Simanek Christopher W | -- | None Available | |
| Boller Brian | -- | Nebraska Land Title | |
| Hendrickson Brian Michael | -- | -- | |
| Hendrickson Brian Michael | -- | -- | |
| Ball Real Estate Co | -- | -- | |
| Ball Real Estate Co | -- | -- |
Source: Public Records
Tax History
| Year | Tax Paid | Tax Assessment Tax Assessment Total Assessment is a certain percentage of the fair market value that is determined by local assessors to be the total taxable value of land and additions on the property. | Land | Improvement |
|---|---|---|---|---|
| 2025 | $2,876 | $202,202 | $27,225 | $174,977 |
| 2024 | $2,938 | $192,669 | $20,873 | $171,796 |
| 2023 | $3,265 | $184,081 | $20,873 | $163,208 |
| 2022 | $3,500 | $178,362 | $20,873 | $157,489 |
| 2021 | $2,908 | $145,013 | $20,873 | $124,140 |
| 2020 | $2,921 | $145,013 | $20,873 | $124,140 |
| 2019 | $2,679 | $132,010 | $20,870 | $111,140 |
| 2018 | $2,724 | $132,010 | $20,870 | $111,140 |
| 2017 | $2,580 | $125,660 | $20,870 | $104,790 |
| 2016 | $2,592 | $116,480 | $20,000 | $96,480 |
| 2015 | $2,488 | $116,480 | $20,000 | $96,480 |
| 2014 | $2,543 | $116,480 | $20,000 | $96,480 |
| 2012 | $2,922 | $116,480 | $20,000 | $96,480 |
Source: Public Records
Map
Nearby Homes
- 704 Beech St
- 0 E Elm St
- 6030 Little Salt Rd
- 551 County Road 20
- 2118 Wilsonville Rd
- 2162 County Road A
- 8645 Agnew Rd
- 5830 Rock Creek Rd
- 135 Hunter St
- 120 Hunter St
- 8601 Agnew Lot 1 Rd
- 8601 Agnew Lot 4 Rd
- 8601 Agnew Lot 3 Rd
- 1198 County Road D
- 6531 Mill Rd
- 500 Mill Rd
- 12550 N 84th St
- 7015 W Agnew Rd
- 12500 N 84th St
- 20201 NW 68th St
Your Personal Tour Guide
Ask me questions while you tour the home.