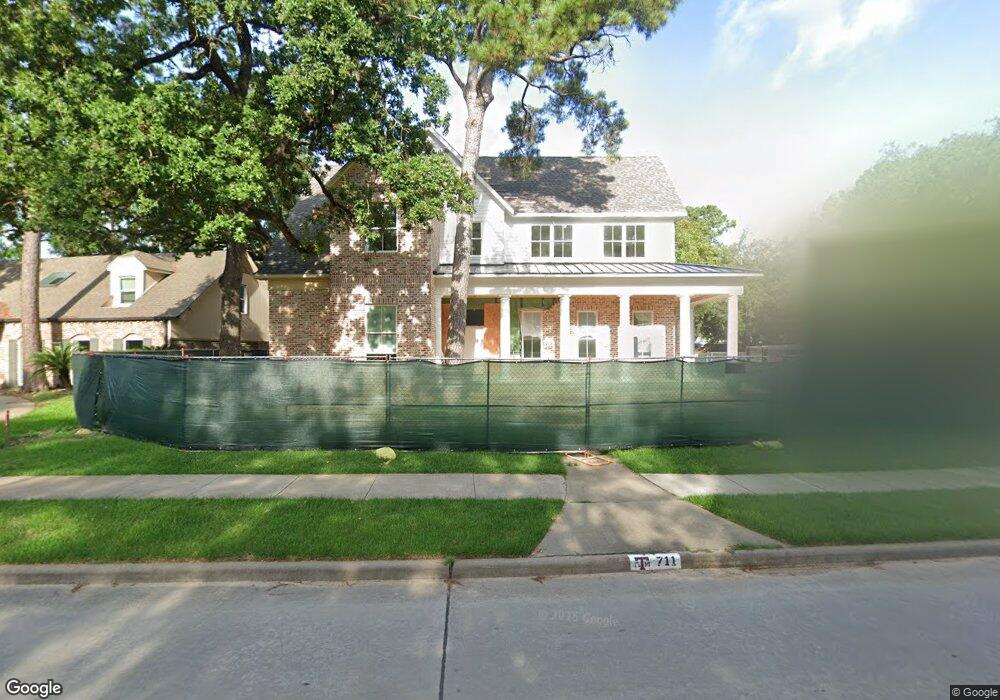
711 Brittmoore Rd Houston, TX 77079
Memorial NeighborhoodEstimated Value: $963,000 - $1,986,000
5
Beds
6
Baths
4,644
Sq Ft
$328/Sq Ft
Est. Value
About This Home
This home is located at 711 Brittmoore Rd, Houston, TX 77079 and is currently estimated at $1,522,751, approximately $327 per square foot. 711 Brittmoore Rd is a home located in Harris County with nearby schools including Rummel Creek Elementary School, Memorial Middle, and Stratford High School.
Ownership History
Date
Name
Owned For
Owner Type
Purchase Details
Closed on
Jan 26, 2006
Sold by
Robinson Stephen M and Robinson Diane F
Bought by
Hartensteiner Frederick J and Hartensteiner Jennifer G
Current Estimated Value
Home Financials for this Owner
Home Financials are based on the most recent Mortgage that was taken out on this home.
Original Mortgage
$276,000
Outstanding Balance
$155,561
Interest Rate
6.22%
Mortgage Type
Fannie Mae Freddie Mac
Estimated Equity
$1,367,190
Purchase Details
Closed on
Feb 21, 1997
Sold by
Baldwin Robert John and Williams Gloria V
Bought by
Robinson Stephen M and Robinson Diane F
Home Financials for this Owner
Home Financials are based on the most recent Mortgage that was taken out on this home.
Original Mortgage
$137,700
Interest Rate
7.25%
Create a Home Valuation Report for This Property
The Home Valuation Report is an in-depth analysis detailing your home's value as well as a comparison with similar homes in the area
Home Values in the Area
Average Home Value in this Area
Purchase History
| Date | Buyer | Sale Price | Title Company |
|---|---|---|---|
| Hartensteiner Frederick J | -- | Startex Title Company | |
| Robinson Stephen M | -- | American Title Company |
Source: Public Records
Mortgage History
| Date | Status | Borrower | Loan Amount |
|---|---|---|---|
| Open | Hartensteiner Frederick J | $276,000 | |
| Previous Owner | Robinson Stephen M | $137,700 |
Source: Public Records
Tax History Compared to Growth
Tax History
| Year | Tax Paid | Tax Assessment Tax Assessment Total Assessment is a certain percentage of the fair market value that is determined by local assessors to be the total taxable value of land and additions on the property. | Land | Improvement |
|---|---|---|---|---|
| 2025 | $16,349 | $2,138,400 | $566,217 | $1,572,183 |
| 2024 | $16,349 | $1,054,023 | $504,448 | $549,575 |
| 2023 | $16,349 | $760,464 | $504,448 | $256,016 |
| 2022 | $14,144 | $720,000 | $483,858 | $236,142 |
| 2021 | $13,428 | $550,000 | $463,269 | $86,731 |
| 2020 | $15,365 | $613,217 | $463,269 | $149,948 |
| 2019 | $16,101 | $614,999 | $463,269 | $151,730 |
| 2018 | $6,020 | $614,999 | $463,269 | $151,730 |
| 2017 | $16,089 | $614,999 | $463,269 | $151,730 |
| 2016 | $14,662 | $620,000 | $463,269 | $156,731 |
| 2015 | $9,653 | $627,000 | $463,269 | $163,731 |
| 2014 | $9,653 | $478,000 | $350,025 | $127,975 |
Source: Public Records
Map
Nearby Homes
- 839 Wax Myrtle Ln
- 13131 Kimberley Ln
- 13004 Trail Hollow Dr Unit A
- 893 Wax Myrtle Ln Unit 3
- 903 Wax Myrtle Ln
- 921 Wax Myrtle Ln
- 939 Wax Myrtle Ln
- 12978 Trail Hollow Dr Unit 2978
- 832 Wax Myrtle Ln Unit 832
- 13346 Trail Hollow Dr Unit 3346
- 13282 Trail Hollow Dr Unit 3282
- 12971 Trail Hollow Dr Unit A
- 12973 Trail Hollow Dr Unit A
- 13228 Trail Hollow Dr Unit 3228
- 866 Myrtlea Ln
- 13316 Trail Hollow Dr Unit 3316
- 13050 Trail Hollow Dr
- 13060 Trail Hollow Dr Unit 3060
- 807 Wycliffe Dr
- 13074 Trail Hollow Dr Unit 3074
- 707 Brittmoore Rd
- 13107 Queensbury Ln
- 13106 Kimberley Ln
- 13102 Kimberley Ln
- 13102 Queensbury Ln
- 710 Brittmoore Rd
- 714 Brittmoore Rd
- 13110 Kimberley Ln
- 706 Brittmoore Rd
- 13106 Queensbury Ln
- 13026 Kimberley Ln
- 13114 Kimberley Ln
- 13038 Queensbury Ln
- 13111 Rummel Creek Rd
- 13022 Kimberley Ln
- 13107 Rummel Creek Rd
- 707 Cinnamon Oak Ln
- 715 Cinnamon Oak Ln
- 13127 Rummel Creek Rd
- 723 Cinnamon Oak Ln