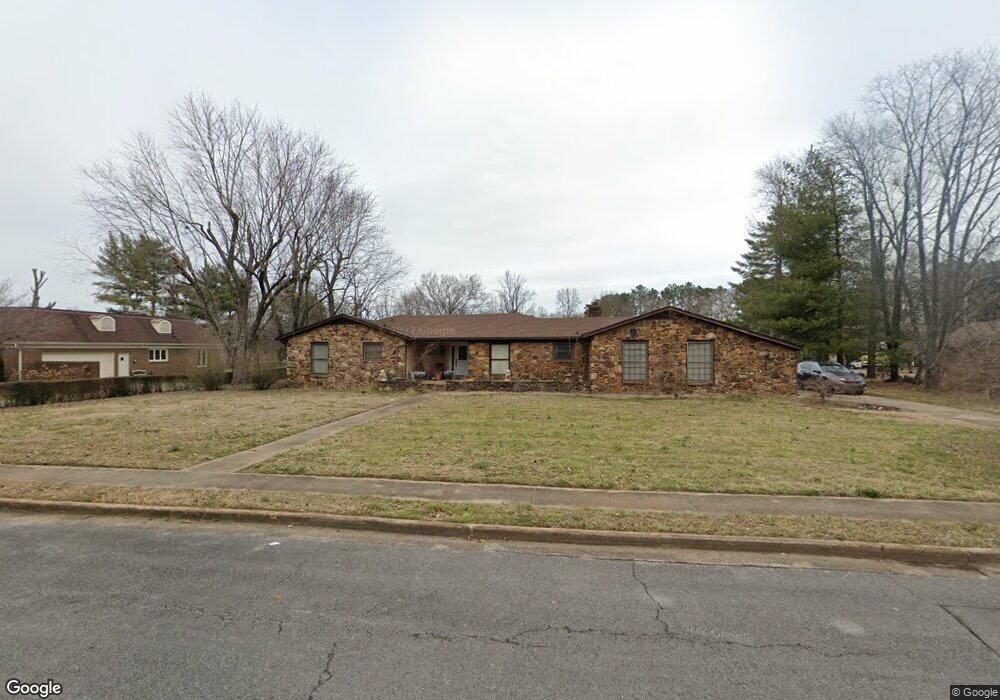
711 Cherokee Ct Murfreesboro, TN 37130
Estimated Value: $426,000 - $589,000
Studio
3
Baths
2,297
Sq Ft
$215/Sq Ft
Est. Value
About This Home
This home is located at 711 Cherokee Ct, Murfreesboro, TN 37130 and is currently estimated at $494,677, approximately $215 per square foot. 711 Cherokee Ct is a home located in Rutherford County with nearby schools including Reeves-Rogers Elementary School, Whitworth-Buchanan Middle School, and Oakland High School.
Ownership History
Date
Name
Owned For
Owner Type
Purchase Details
Closed on
Feb 11, 2019
Sold by
Robinson Jennifer Michelle and Robinson Eric
Bought by
Robinson Jennifer Michelle and Robinson Eric
Current Estimated Value
Home Financials for this Owner
Home Financials are based on the most recent Mortgage that was taken out on this home.
Original Mortgage
$86,487
Outstanding Balance
$55,916
Interest Rate
4.75%
Mortgage Type
FHA
Estimated Equity
$438,761
Purchase Details
Closed on
Nov 27, 2018
Sold by
Robinson Jennifer Michelle and Estate Of Bruce Alan Fortner
Bought by
Robinson Jennifer Michelle
Purchase Details
Closed on
Apr 17, 2017
Sold by
Poole Nona and Fortner Revocable Trust
Bought by
Fortner Bruce
Purchase Details
Closed on
Dec 15, 2015
Sold by
Fortner Nona G
Bought by
Fortner Nona G and Fortner Revocable Trust
Purchase Details
Closed on
Apr 5, 1999
Sold by
Fortner Robt E
Bought by
David Blair
Create a Home Valuation Report for This Property
The Home Valuation Report is an in-depth analysis detailing your home's value as well as a comparison with similar homes in the area
Home Values in the Area
Average Home Value in this Area
Purchase History
| Date | Buyer | Sale Price | Title Company |
|---|---|---|---|
| Robinson Jennifer Michelle | -- | Closing Usa Llc | |
| Robinson Jennifer Michelle | -- | None Available | |
| Fortner Bruce | -- | None Available | |
| Fortner Nona G | -- | None Available | |
| David Blair | $107,000 | -- |
Source: Public Records
Mortgage History
| Date | Status | Borrower | Loan Amount |
|---|---|---|---|
| Open | Robinson Jennifer Michelle | $86,487 |
Source: Public Records
Tax History
| Year | Tax Paid | Tax Assessment Tax Assessment Total Assessment is a certain percentage of the fair market value that is determined by local assessors to be the total taxable value of land and additions on the property. | Land | Improvement |
|---|---|---|---|---|
| 2025 | $2,632 | $93,050 | $13,750 | $79,300 |
| 2024 | $2,632 | $93,050 | $13,750 | $79,300 |
| 2023 | $1,737 | $92,575 | $13,750 | $78,825 |
| 2022 | $1,496 | $92,575 | $13,750 | $78,825 |
| 2021 | $1,513 | $68,150 | $13,750 | $54,400 |
| 2020 | $1,513 | $68,150 | $13,750 | $54,400 |
| 2019 | $1,513 | $68,150 | $13,750 | $54,400 |
| 2018 | $2,078 | $68,150 | $0 | $0 |
| 2017 | $2,322 | $59,725 | $0 | $0 |
| 2016 | $2,322 | $59,725 | $0 | $0 |
| 2015 | $2,322 | $59,725 | $0 | $0 |
| 2014 | $1,485 | $59,725 | $0 | $0 |
| 2013 | -- | $46,750 | $0 | $0 |
Source: Public Records
Map
Nearby Homes
- 908 Empire Blvd
- 912 Empire Blvd
- 1014 Empire Blvd
- 1029 Empire Blvd
- 2336 Convention Way
- 600 Twin Oak Dr
- 1019 Tradition Trail
- 1245 Old Lascassas Rd Unit E1
- 2506 E Main St Unit E6
- 1810 Dr Martin Luther King jr Blvd
- 1814 Dr Martin Luther King jr Blvd
- 2187 Gold Valley Dr
- 319 Minerva Dr
- 1307 Amsterdam Ct
- 411 Apollo Dr
- 1306 Tweedle Ct
- 4426 Adoree Dr
- 2961 S Rutherford Blvd Unit C2
- 2961 S Rutherford Blvd Unit C3
- 1412 Bunny Ct
- 707 Cherokee Ct
- 715 Cherokee Ct
- 719 Cherokee Ct
- 0 Riley Rd Unit 1759356
- 710 Cherokee Ct
- 706 Cherokee Ct
- 723 Cherokee Ct
- 714 Cherokee Ct
- 702 Cherokee Ct
- 726 Cherokee Ct
- 710 N Rutherford Blvd
- 722 Cherokee Ct
- 718 Cherokee Ct
- 730 Cherokee Ct
- 734 Cherokee Ct
- 727 Cherokee Ct
- 714 N Rutherford Blvd
- 707 N Rutherford Blvd
- 703 N Rutherford Blvd
- 703 Lillard Rd
Your Personal Tour Guide
Ask me questions while you tour the home.