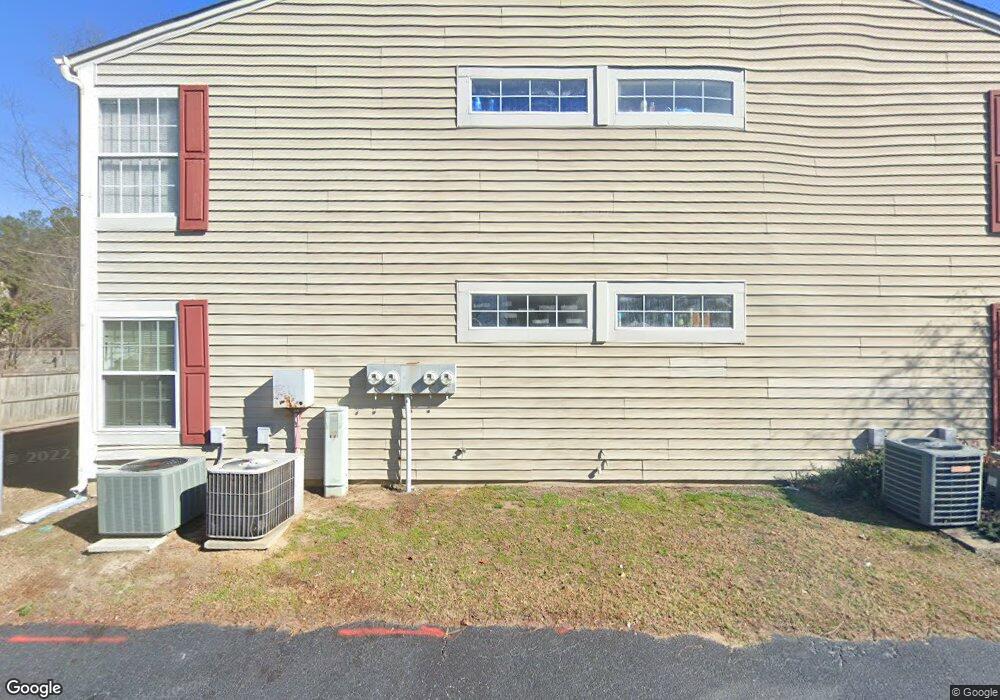
711 Coventry Ln Unit A3 Florence, SC 29501
Estimated Value: $103,000 - $158,000
3
Beds
2
Baths
1,120
Sq Ft
$112/Sq Ft
Est. Value
About This Home
This home is located at 711 Coventry Ln Unit A3, Florence, SC 29501 and is currently estimated at $125,000, approximately $111 per square foot. 711 Coventry Ln Unit A3 is a home located in Florence County with nearby schools including Carver Elementary School, Henry L. Sneed Middle School, and John W. Moore Middle School.
Ownership History
Date
Name
Owned For
Owner Type
Purchase Details
Closed on
Oct 7, 2022
Sold by
Pritchard Barbara
Bought by
Pritchard Barbara and Pritchard-Boone Andrea Lea
Current Estimated Value
Purchase Details
Closed on
Sep 15, 2016
Sold by
Goodson Mary W and Weatherford Mary M
Bought by
Pritchard Barbara
Home Financials for this Owner
Home Financials are based on the most recent Mortgage that was taken out on this home.
Interest Rate
3.5%
Purchase Details
Closed on
Jun 15, 2005
Sold by
Brown Robert C and Brown Diane M
Bought by
Weatherford Mary M
Home Financials for this Owner
Home Financials are based on the most recent Mortgage that was taken out on this home.
Original Mortgage
$65,475
Interest Rate
5.66%
Mortgage Type
New Conventional
Purchase Details
Closed on
Jul 14, 2004
Sold by
Stone Margaret L
Bought by
Brown Robert C and Brown Diane M
Create a Home Valuation Report for This Property
The Home Valuation Report is an in-depth analysis detailing your home's value as well as a comparison with similar homes in the area
Purchase History
| Date | Buyer | Sale Price | Title Company |
|---|---|---|---|
| Pritchard Barbara | -- | -- | |
| Pritchard Barbara | -- | -- | |
| Weatherford Mary M | $67,500 | -- | |
| Brown Robert C | $65,000 | -- |
Source: Public Records
Mortgage History
| Date | Status | Borrower | Loan Amount |
|---|---|---|---|
| Previous Owner | Pritchard Barbara | -- | |
| Previous Owner | Weatherford Mary M | $65,475 |
Source: Public Records
Tax History
| Year | Tax Paid | Tax Assessment Tax Assessment Total Assessment is a certain percentage of the fair market value that is determined by local assessors to be the total taxable value of land and additions on the property. | Land | Improvement |
|---|---|---|---|---|
| 2024 | $1,433 | $3,589 | $280 | $3,309 |
| 2023 | $1,265 | $2,480 | $280 | $2,200 |
| 2022 | $189 | $2,480 | $0 | $0 |
| 2021 | $62 | $2,480 | $0 | $0 |
| 2020 | $167 | $2,480 | $0 | $0 |
| 2019 | $167 | $2,480 | $280 | $2,200 |
| 2018 | $171 | $2,480 | $0 | $0 |
| 2017 | $1,229 | $3,720 | $0 | $0 |
| 2016 | $250 | $2,720 | $0 | $0 |
| 2015 | $247 | $2,720 | $0 | $0 |
| 2014 | $227 | $2,722 | $280 | $2,442 |
Source: Public Records
Map
Nearby Homes
- 4145 Rodanthe Cir
- 4156 Rodanthe Cir
- 634 Stoneybrook Terrace
- 608 Stoneybrook Terrace
- 739 Harriett Dr
- 4178 Rodanthe Cir
- 3821 Ashwood Ln
- 708 Muirfield Place
- 4135 W Pelican Ln
- 3825 Charters Dr
- 1732 Oakdale Terrace Blvd
- 1717 Oakdale Terrace Blvd
- 724 Caledonia Ct
- 4023 Roxboro Ct
- 4286 Monterey Dr
- 851 S Dunes Dr
- 307 Fairhaven St
- 3941 Lake Oakdale Dr
- 3046 Southborough Rd
- 3703 State Road S-21-1389
- 711 Coventry Ln
- 711 Coventry Ln Unit B8
- 711 Coventry Ln Unit B7
- 711 Coventry Ln Unit B6
- 711 Coventry Ln Unit B5
- 711 Coventry Ln Unit B4
- 711 Coventry Ln Unit B3
- 711 Coventry Ln Unit B2
- 711 Coventry Ln Unit B1
- 711 Coventry Ln Unit A8
- 711 Coventry Ln Unit A2
- 711 Coventry Ln Unit A1
- 711 Coventry Ln Unit A5
- 711 Coventry Ln Unit A7
- 711 Coventry Ln Unit A6
- 711 Coventry Ln Unit A4
- 711 Coventry Ln
- 711 Coventry Ln
- 716 S Briarleigh Rd
- 721 Coventry Ln Unit S