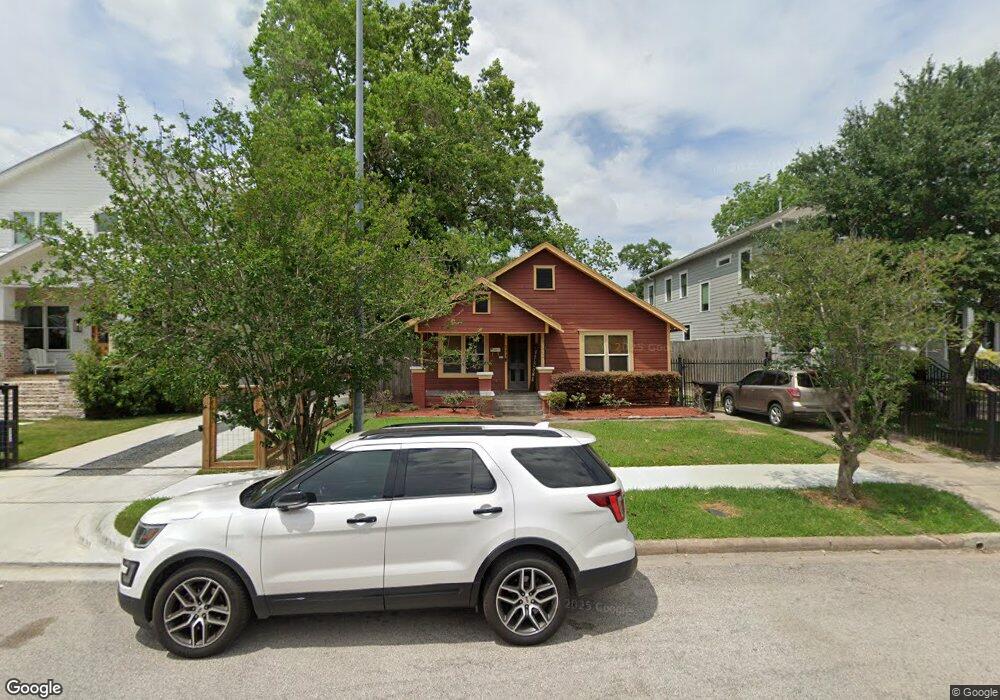
711 E 13th St Houston, TX 77008
Greater Heights NeighborhoodEstimated Value: $711,800 - $842,000
2
Beds
2
Baths
1,476
Sq Ft
$526/Sq Ft
Est. Value
About This Home
This home is located at 711 E 13th St, Houston, TX 77008 and is currently estimated at $776,950, approximately $526 per square foot. 711 E 13th St is a home located in Harris County with nearby schools including Field Elementary School, Hogg Middle, and Heights High School.
Ownership History
Date
Name
Owned For
Owner Type
Purchase Details
Closed on
Jul 27, 2007
Sold by
Denzler James Sprunt
Bought by
Subramanian Suresh
Current Estimated Value
Home Financials for this Owner
Home Financials are based on the most recent Mortgage that was taken out on this home.
Original Mortgage
$191,200
Outstanding Balance
$121,367
Interest Rate
6.71%
Mortgage Type
Purchase Money Mortgage
Estimated Equity
$655,583
Purchase Details
Closed on
Nov 15, 2002
Sold by
Klein Steve and Klein Jamie Gamble
Bought by
Denzler James Sprunt
Home Financials for this Owner
Home Financials are based on the most recent Mortgage that was taken out on this home.
Original Mortgage
$103,000
Interest Rate
5.89%
Purchase Details
Closed on
May 12, 2000
Sold by
Arabruster Courtney W
Bought by
Klein Steven
Home Financials for this Owner
Home Financials are based on the most recent Mortgage that was taken out on this home.
Original Mortgage
$140,000
Interest Rate
8.18%
Create a Home Valuation Report for This Property
The Home Valuation Report is an in-depth analysis detailing your home's value as well as a comparison with similar homes in the area
Home Values in the Area
Average Home Value in this Area
Purchase History
| Date | Buyer | Sale Price | Title Company |
|---|---|---|---|
| Subramanian Suresh | -- | Startex Title Company | |
| Denzler James Sprunt | -- | -- | |
| Klein Steven | -- | -- |
Source: Public Records
Mortgage History
| Date | Status | Borrower | Loan Amount |
|---|---|---|---|
| Open | Subramanian Suresh | $191,200 | |
| Previous Owner | Denzler James Sprunt | $103,000 | |
| Previous Owner | Klein Steven | $140,000 | |
| Closed | Klein Steven | $17,500 |
Source: Public Records
Tax History
| Year | Tax Paid | Tax Assessment Tax Assessment Total Assessment is a certain percentage of the fair market value that is determined by local assessors to be the total taxable value of land and additions on the property. | Land | Improvement |
|---|---|---|---|---|
| 2025 | $11,502 | $698,694 | $593,750 | $104,944 |
| 2024 | $11,502 | $762,889 | $562,500 | $200,389 |
| 2023 | $11,502 | $734,099 | $562,500 | $171,599 |
| 2022 | $13,425 | $668,011 | $500,000 | $168,011 |
| 2021 | $12,919 | $554,297 | $418,750 | $135,547 |
| 2020 | $12,578 | $523,979 | $406,250 | $117,729 |
| 2019 | $11,949 | $521,500 | $387,500 | $134,000 |
| 2018 | $8,431 | $429,265 | $375,000 | $54,265 |
| 2017 | $11,631 | $460,000 | $375,000 | $85,000 |
| 2016 | $10,916 | $440,000 | $337,500 | $102,500 |
| 2015 | $7,196 | $414,000 | $281,250 | $132,750 |
| 2014 | $7,196 | $391,800 | $270,000 | $121,800 |
Source: Public Records
Map
Nearby Homes
- 635 E 13th St
- 623 E 13th St
- 627 E 14th St
- 1111 Fugate St
- 1102 E 14th St
- 805 Ralfallen St
- 1111 Studewood St Unit 503
- 4008 Norhill Blvd
- 1114 W Cottage St
- 1121 Key St
- 1108 W Cottage St
- 1032 Algregg St
- 1020 E 14th St
- 1418 Columbia St
- 4030 Pineridge St
- 1015 E 14th St
- 607 E 15th St
- 1011 W Cottage St
- 1391 Arlington St Unit 1391
- 1377 Arlington St Unit 1377
- 713 E 13th St
- 709 E 13th St
- 715 E 13th St
- 707 E 13th St
- 718 E 13th 1/2 St
- 728 E 13th 1/2 St
- 714 E 13th 1/2 St
- 717 E 13th St
- 705 E 13th St
- 722 E 13th 1/2 St
- 708 E 13th 1/2 St
- 701 E 13th St
- 733 E 13th St
- 706 E 13th 1/2 St
- 730 E 13th 1/2 St
- 706 1/2 E 13th 1/2 St
- 720 E 13th St
- 728 E 13th St
- 714 E 13th St
- 712 E 13th St
Your Personal Tour Guide
Ask me questions while you tour the home.