711 E 5th Ave Kennewick, WA 99336
Estimated Value: $230,964 - $296,000
2
Beds
1
Bath
796
Sq Ft
$329/Sq Ft
Est. Value
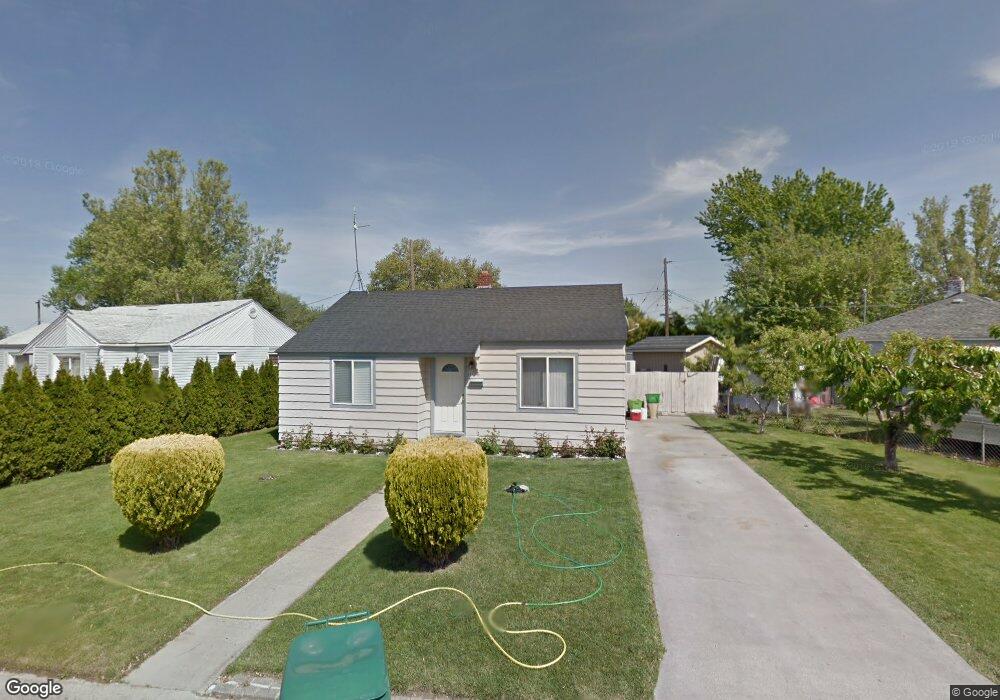
About This Home
This home is located at 711 E 5th Ave, Kennewick, WA 99336 and is currently estimated at $261,741, approximately $328 per square foot. 711 E 5th Ave is a home located in Benton County with nearby schools including Eastgate Elementary School, Horse Heaven Hills Middle School, and Kennewick High School.
Ownership History
Date
Name
Owned For
Owner Type
Purchase Details
Closed on
Aug 22, 2007
Sold by
Grande Jose and Gonzalez Angela Valencia
Bought by
Alvarez Mayra
Current Estimated Value
Home Financials for this Owner
Home Financials are based on the most recent Mortgage that was taken out on this home.
Original Mortgage
$80,083
Outstanding Balance
$61,715
Interest Rate
12%
Mortgage Type
FHA
Estimated Equity
$200,026
Purchase Details
Closed on
Aug 20, 2007
Sold by
Perez Cardenas Roberto
Bought by
Alvarez Mayra
Home Financials for this Owner
Home Financials are based on the most recent Mortgage that was taken out on this home.
Original Mortgage
$80,083
Outstanding Balance
$61,715
Interest Rate
12%
Mortgage Type
FHA
Estimated Equity
$200,026
Purchase Details
Closed on
Dec 7, 2006
Sold by
Grande Jose
Bought by
Grande Jose and Gonzalez Angela Valencia
Create a Home Valuation Report for This Property
The Home Valuation Report is an in-depth analysis detailing your home's value as well as a comparison with similar homes in the area
Purchase History
| Date | Buyer | Sale Price | Title Company |
|---|---|---|---|
| Alvarez Mayra | $90,000 | Frontier Title & Esc | |
| Alvarez Mayra | -- | Frontier Title & Esc | |
| Grande Jose | -- | None Available |
Source: Public Records
Mortgage History
| Date | Status | Borrower | Loan Amount |
|---|---|---|---|
| Open | Alvarez Mayra | $80,083 | |
| Closed | Alvarez Mayra | $10,000 |
Source: Public Records
Tax History
| Year | Tax Paid | Tax Assessment Tax Assessment Total Assessment is a certain percentage of the fair market value that is determined by local assessors to be the total taxable value of land and additions on the property. | Land | Improvement |
|---|---|---|---|---|
| 2025 | $1,847 | $195,900 | $70,000 | $125,900 |
| 2024 | $1,730 | $188,040 | $70,000 | $118,040 |
| 2023 | $1,730 | $176,230 | $70,000 | $106,230 |
| 2022 | $1,559 | $148,690 | $70,000 | $78,690 |
| 2021 | $1,385 | $131,160 | $40,000 | $91,160 |
| 2020 | $1,397 | $113,160 | $22,000 | $91,160 |
| 2019 | $1,296 | $110,120 | $22,000 | $88,120 |
| 2018 | $1,254 | $104,040 | $22,000 | $82,040 |
| 2017 | $1,151 | $82,770 | $22,000 | $60,770 |
| 2016 | $1,216 | $82,770 | $22,000 | $60,770 |
| 2015 | $1,175 | $86,990 | $22,000 | $64,990 |
| 2014 | -- | $83,090 | $22,000 | $61,090 |
| 2013 | -- | $83,090 | $22,000 | $61,090 |
Source: Public Records
Map
Nearby Homes
- 501 S Fir St
- 408 S Gum St
- 406 S Fir St
- 909 S Gum St
- 608 E 8th Ave
- 900 S Gum St
- NKA Washington 397
- 837 S Hawthorne St
- 229 E 5th Ave
- 3 N Gum St
- 218 E 8th Place
- 706 S Alder St
- 1526 E 3rd Ave
- 1421 S Cedar St Unit 8
- 1421 S Cedar St
- 1421 S Cedar #82 St
- 11 W 2nd Ave
- 17 E 13th Ave
- 2804 S Beech St Unit Lot 8
- 2731 S Alder St
Your Personal Tour Guide
Ask me questions while you tour the home.