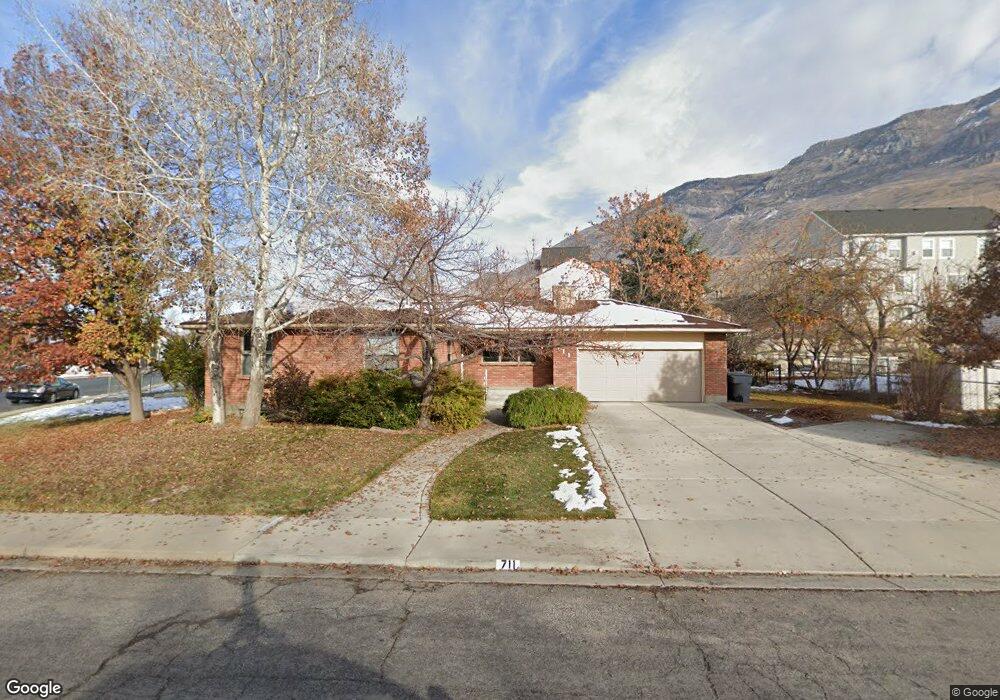
711 E 930 N Pleasant Grove, UT 84062
Estimated Value: $600,000 - $666,000
4
Beds
3
Baths
1,621
Sq Ft
$387/Sq Ft
Est. Value
About This Home
This home is located at 711 E 930 N, Pleasant Grove, UT 84062 and is currently estimated at $626,624, approximately $386 per square foot. 711 E 930 N is a home located in Utah County with nearby schools including Grovecrest Elementary School, Pleasant Grove Junior High School, and Pleasant Grove High School.
Ownership History
Date
Name
Owned For
Owner Type
Purchase Details
Closed on
Feb 6, 2023
Sold by
Steele Thomas S and Steele Sandra S
Bought by
Thomas Steward Steele And Sandra Shipley Stee and Steele
Current Estimated Value
Purchase Details
Closed on
Sep 2, 1997
Sold by
Campbell Nancy C Mcnall and Mcnall Nancy C
Bought by
Steele Thomas S and Steele Sandra S
Home Financials for this Owner
Home Financials are based on the most recent Mortgage that was taken out on this home.
Original Mortgage
$147,250
Interest Rate
7.42%
Create a Home Valuation Report for This Property
The Home Valuation Report is an in-depth analysis detailing your home's value as well as a comparison with similar homes in the area
Home Values in the Area
Average Home Value in this Area
Purchase History
| Date | Buyer | Sale Price | Title Company |
|---|---|---|---|
| Thomas Steward Steele And Sandra Shipley Stee | -- | None Listed On Document | |
| Steele Thomas S | -- | -- |
Source: Public Records
Mortgage History
| Date | Status | Borrower | Loan Amount |
|---|---|---|---|
| Previous Owner | Steele Thomas S | $147,250 |
Source: Public Records
Tax History
| Year | Tax Paid | Tax Assessment Tax Assessment Total Assessment is a certain percentage of the fair market value that is determined by local assessors to be the total taxable value of land and additions on the property. | Land | Improvement |
|---|---|---|---|---|
| 2025 | $2,448 | $309,485 | -- | -- |
| 2024 | $2,335 | $285,725 | $0 | $0 |
| 2023 | $2,335 | $285,285 | $0 | $0 |
| 2022 | $2,399 | $291,610 | $0 | $0 |
| 2021 | $2,169 | $401,500 | $173,200 | $228,300 |
| 2020 | $1,986 | $360,300 | $154,600 | $205,700 |
| 2019 | $1,787 | $335,300 | $146,900 | $188,400 |
| 2018 | $1,707 | $302,900 | $139,100 | $163,800 |
| 2017 | $1,648 | $155,705 | $0 | $0 |
| 2016 | $1,537 | $140,195 | $0 | $0 |
| 2015 | $1,574 | $135,960 | $0 | $0 |
Source: Public Records
Map
Nearby Homes
Your Personal Tour Guide
Ask me questions while you tour the home.