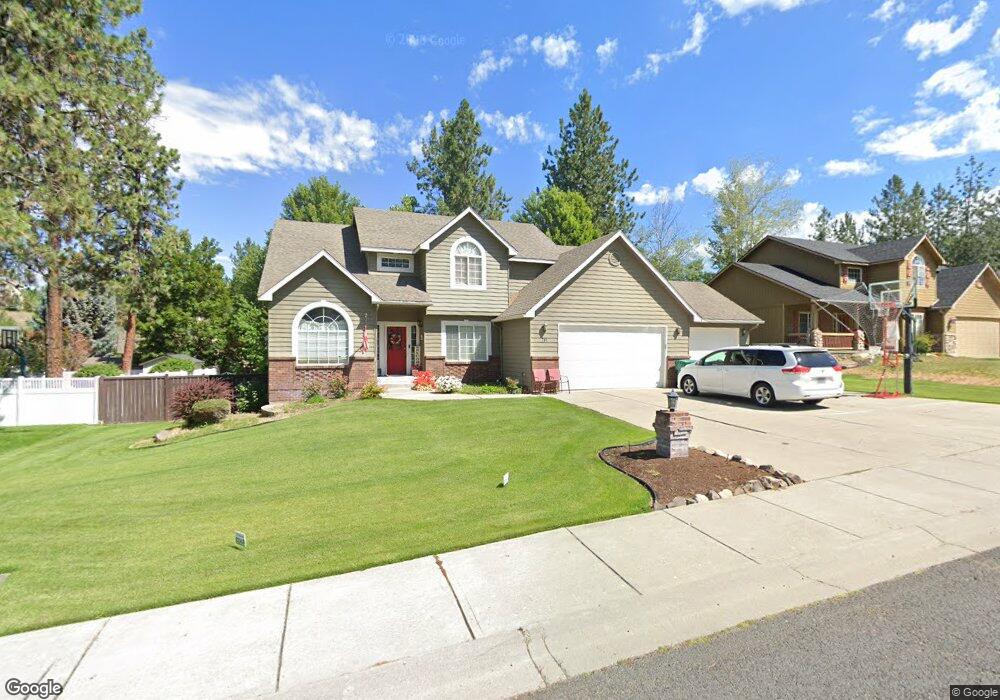
711 E Blackhawk Dr Spokane, WA 99208
Dartford NeighborhoodEstimated Value: $606,000 - $682,000
5
Beds
4
Baths
2,164
Sq Ft
$302/Sq Ft
Est. Value
About This Home
This home is located at 711 E Blackhawk Dr, Spokane, WA 99208 and is currently estimated at $652,946, approximately $301 per square foot. 711 E Blackhawk Dr is a home located in Spokane County with nearby schools including Farwell Elementary School, Northwood Middle School, and Mead Senior High School.
Ownership History
Date
Name
Owned For
Owner Type
Purchase Details
Closed on
Apr 12, 2002
Sold by
Cendant Mobility Financial Corp
Bought by
Farias Ramon A and Farias Lynn M
Current Estimated Value
Home Financials for this Owner
Home Financials are based on the most recent Mortgage that was taken out on this home.
Original Mortgage
$178,000
Outstanding Balance
$75,210
Interest Rate
7.08%
Estimated Equity
$577,736
Purchase Details
Closed on
Jan 23, 1998
Sold by
Johnson Brothers Construction Inc
Bought by
Seaton Brad S and Seaton Jilean
Home Financials for this Owner
Home Financials are based on the most recent Mortgage that was taken out on this home.
Original Mortgage
$176,000
Interest Rate
7.05%
Purchase Details
Closed on
May 5, 1997
Sold by
Ridgecrest Developments
Bought by
Johnson Brothers Construction Inc
Home Financials for this Owner
Home Financials are based on the most recent Mortgage that was taken out on this home.
Original Mortgage
$152,000
Interest Rate
10%
Create a Home Valuation Report for This Property
The Home Valuation Report is an in-depth analysis detailing your home's value as well as a comparison with similar homes in the area
Home Values in the Area
Average Home Value in this Area
Purchase History
| Date | Buyer | Sale Price | Title Company |
|---|---|---|---|
| Farias Ramon A | -- | First American Title Ins | |
| Cendant Mobility Financial Corp | $222,500 | First American Title Ins | |
| Seaton Brad S | $201,000 | Transnation Title Insurance | |
| Johnson Brothers Construction Inc | $32,000 | Transnation Title Ins Co |
Source: Public Records
Mortgage History
| Date | Status | Borrower | Loan Amount |
|---|---|---|---|
| Open | Farias Ramon A | $178,000 | |
| Previous Owner | Seaton Brad S | $176,000 | |
| Previous Owner | Johnson Brothers Construction Inc | $152,000 |
Source: Public Records
Tax History
| Year | Tax Paid | Tax Assessment Tax Assessment Total Assessment is a certain percentage of the fair market value that is determined by local assessors to be the total taxable value of land and additions on the property. | Land | Improvement |
|---|---|---|---|---|
| 2025 | $6,069 | $610,900 | $120,000 | $490,900 |
| 2024 | $6,069 | $596,800 | $95,000 | $501,800 |
| 2023 | $5,479 | $620,600 | $90,000 | $530,600 |
| 2022 | $4,598 | $591,800 | $90,000 | $501,800 |
| 2021 | $4,108 | $356,900 | $60,000 | $296,900 |
| 2020 | $4,084 | $338,300 | $60,000 | $278,300 |
| 2019 | $3,842 | $322,000 | $60,000 | $262,000 |
| 2018 | $4,288 | $306,600 | $60,000 | $246,600 |
| 2017 | $4,013 | $288,300 | $60,000 | $228,300 |
| 2016 | $3,809 | $266,000 | $60,000 | $206,000 |
| 2015 | $3,570 | $255,000 | $60,000 | $195,000 |
| 2014 | -- | $249,500 | $60,000 | $189,500 |
| 2013 | -- | $0 | $0 | $0 |
Source: Public Records
Map
Nearby Homes
- 805 E Blackhawk Dr
- 714 E Erica Ct
- 15709 N Glencrest Ct
- 801 E Huron Dr
- 1023 E Golden Ct
- 1224 E Blackhawk Dr
- 16520 N Dakota Ct
- 15920 N Glencrest Dr
- 15323 N Gleneden St
- 1118 E Eastview Dr
- 16721 N Dakota Ln
- 15116 N Edencrest Dr
- 16767 N Wellington Rd
- 305 E Midway Rd
- 16785 N Wellington Rd
- 16803 N Wellington Rd
- 15424 N Juneberry Dr
- 712 E Bonnie Lynn Ln
- 716 E Bonnie Lynn Ln
- 510 E Golden Eagle Ln
- 717 E Blackhawk Dr
- 705 E Blackhawk Dr
- 702 E Golden Lot
- 702 E Golden Rd
- 704 E Golden Rd
- 710 E Blackhawk Dr
- 721 E Blackhawk Dr
- 602 E Golden Rd
- 716 E Blackhawk Dr
- 704 E Blackhawk Dr
- 708 E Erica Ct
- 706 E Erica Ct
- 720 E Blackhawk Dr
- 617 E Blackhawk Dr
- 620 E Blackhawk Dr
- 621 Golden Ct
- 710 E Erica Ct
- 703 E Golden Rd
- 806 E Blackhawk Dr
- 705 E Golden Rd
Your Personal Tour Guide
Ask me questions while you tour the home.