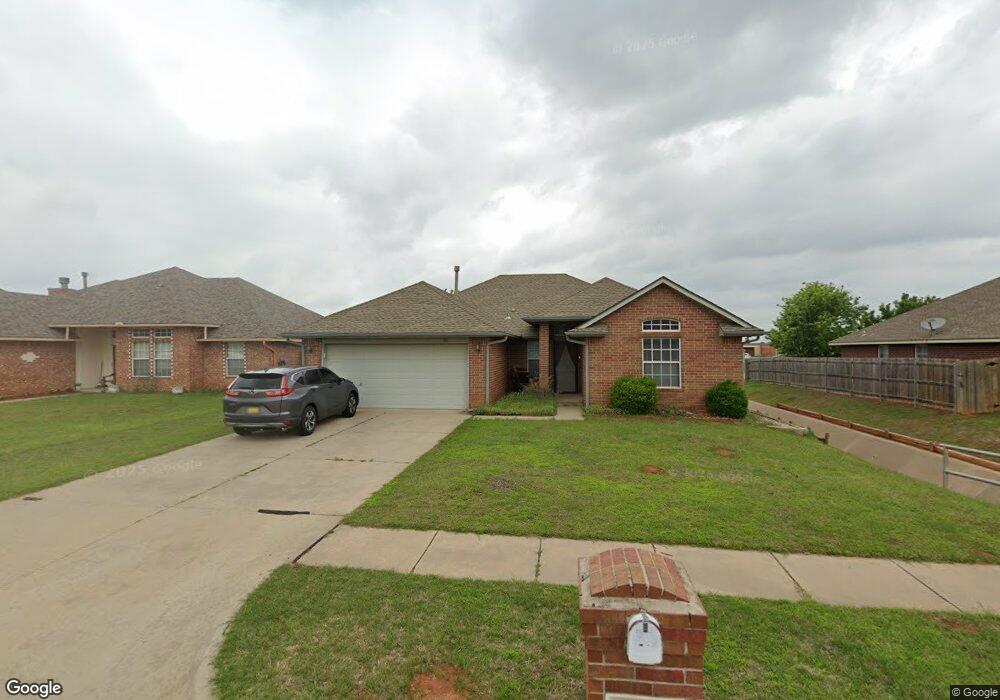
711 E Pointe Court Ln Mustang, OK 73064
Estimated Value: $221,000 - $243,000
3
Beds
2
Baths
1,602
Sq Ft
$145/Sq Ft
Est. Value
About This Home
This home is located at 711 E Pointe Court Ln, Mustang, OK 73064 and is currently estimated at $233,017, approximately $145 per square foot. 711 E Pointe Court Ln is a home located in Canadian County with nearby schools including Mustang Elementary School, Mustang Horizon Intermediate School, and Mustang Middle School.
Ownership History
Date
Name
Owned For
Owner Type
Purchase Details
Closed on
May 30, 2019
Sold by
17 6 Llc
Bought by
17 6 Llc
Current Estimated Value
Purchase Details
Closed on
Sep 27, 2010
Sold by
Secretary Of Housing & Urban Development
Bought by
Reuter Jeffrey and Reuter Melinda
Purchase Details
Closed on
May 17, 2010
Sold by
Hannebaum Brian and Hannebaum Natalie
Bought by
Secretary Of Housing & Urban Development
Purchase Details
Closed on
Jan 29, 2007
Sold by
Manwarren Howard and Manwarren Ramona
Bought by
Hannebaum Brian and Hannebaum Natalie
Home Financials for this Owner
Home Financials are based on the most recent Mortgage that was taken out on this home.
Original Mortgage
$140,760
Interest Rate
6.11%
Mortgage Type
FHA
Purchase Details
Closed on
Nov 4, 2004
Sold by
Erc Land Development Group~Llc
Create a Home Valuation Report for This Property
The Home Valuation Report is an in-depth analysis detailing your home's value as well as a comparison with similar homes in the area
Home Values in the Area
Average Home Value in this Area
Purchase History
| Date | Buyer | Sale Price | Title Company |
|---|---|---|---|
| 17 6 Llc | -- | None Available | |
| Reuter Jeffrey | -- | Heartland Title & Closing Ll | |
| Secretary Of Housing & Urban Development | -- | Ort | |
| Hannebaum Brian | $108,000 | American Guaranty Title Co | |
| -- | $60,000 | -- |
Source: Public Records
Mortgage History
| Date | Status | Borrower | Loan Amount |
|---|---|---|---|
| Previous Owner | Hannebaum Brian | $140,760 |
Source: Public Records
Tax History Compared to Growth
Tax History
| Year | Tax Paid | Tax Assessment Tax Assessment Total Assessment is a certain percentage of the fair market value that is determined by local assessors to be the total taxable value of land and additions on the property. | Land | Improvement |
|---|---|---|---|---|
| 2024 | $1,981 | $20,850 | $2,580 | $18,270 |
| 2023 | $1,981 | $19,857 | $2,580 | $17,277 |
| 2022 | $1,909 | $18,911 | $2,580 | $16,331 |
| 2021 | $1,826 | $18,011 | $2,580 | $15,431 |
| 2020 | $1,750 | $17,153 | $2,580 | $14,573 |
| 2019 | $1,666 | $16,336 | $2,580 | $13,756 |
| 2018 | $1,748 | $16,771 | $2,580 | $14,191 |
| 2017 | $1,747 | $16,955 | $2,580 | $14,375 |
| 2016 | $1,786 | $17,500 | $2,580 | $14,920 |
| 2015 | $1,686 | $16,473 | $2,580 | $13,893 |
| 2014 | $1,686 | $16,238 | $2,580 | $13,658 |
Source: Public Records
Map
Nearby Homes
- 1009 S Blackjack Ln
- 427 S Castlerock Circle Ln
- 531 E Juniper Ln
- 720 E Linden Ln
- 421 E Hillcrest Ln
- 224 N Richard Terrace
- 316 E Greenwood Ln
- 313 E Suera Terrace
- Belmore Plus Plan at Wild Horse Canyon
- Duxbury Plan at Wild Horse Canyon
- Charlotte Plan at Wild Horse Canyon
- Bristol Plan at Wild Horse Canyon
- Belmore Plan at Wild Horse Canyon
- Ashton Plan at Wild Horse Canyon
- Abingdon Plan at Wild Horse Canyon
- 636 E Lea Terrace
- 1204 E Stetson Ln
- 1121 E Stetson Ln
- 1117 E Stetson Ln
- 1237 E Stetson Ln
- 707 E Pointe Court Ln
- 715 E Pointe Court Ln
- 719 E Pointe Court Ln
- 715 E Elder Ln
- 723 E Pointe Court Ln
- 403 S Pointe Ln
- 719 E Elder Ln
- 404 S Pointe Ln
- 320 S Castle Ridge Ln
- 324 S Castle Ridge Ln
- 724 E Pointe Court Ln
- 727 E Pointe Court Ln
- 328 S Castle Ridge Ln
- 407 S Pointe Ln
- 408 S Pointe Ln
- 723 E Elder Ln
- 716 E Elder Ln
- 641 E Katelyn Ln
- 720 E Elder Ln
- 728 E Pointe Court Ln