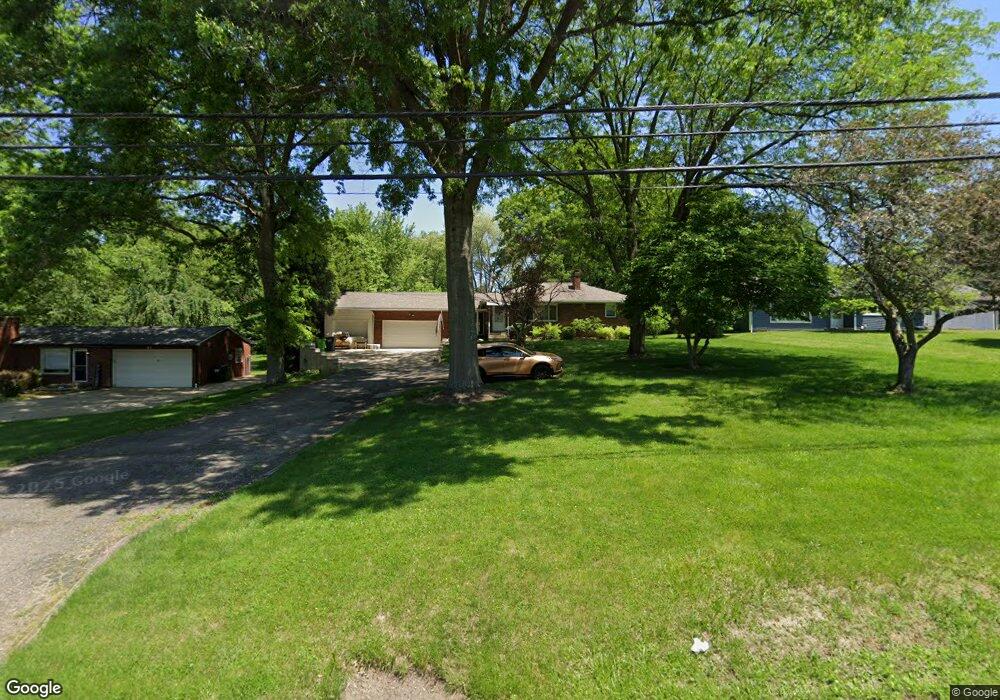
711 E State St Barberton, OH 44203
East Barberton NeighborhoodEstimated Value: $193,000 - $246,000
2
Beds
2
Baths
1,177
Sq Ft
$180/Sq Ft
Est. Value
About This Home
This home is located at 711 E State St, Barberton, OH 44203 and is currently estimated at $211,274, approximately $179 per square foot. 711 E State St is a home located in Summit County with nearby schools including Barberton Intermediate School 3-5, Barberton Middle School, and Barberton High School.
Ownership History
Date
Name
Owned For
Owner Type
Purchase Details
Closed on
Aug 11, 2023
Sold by
Watts Jennifer L
Bought by
Watts Brenda and Watts Donald
Current Estimated Value
Purchase Details
Closed on
Oct 5, 2009
Sold by
Hensley Darlene R and Brown Debra A
Bought by
Watts Jennifer L
Home Financials for this Owner
Home Financials are based on the most recent Mortgage that was taken out on this home.
Original Mortgage
$117,912
Interest Rate
5.19%
Mortgage Type
FHA
Purchase Details
Closed on
Aug 8, 2000
Sold by
Hensley Darlene R and Long Martha M
Bought by
Hensley Darlene R and Brown Debra A
Purchase Details
Closed on
Jul 17, 1995
Sold by
Ghaster Ricky J
Bought by
Hensley Darlene R and Long Martha M
Create a Home Valuation Report for This Property
The Home Valuation Report is an in-depth analysis detailing your home's value as well as a comparison with similar homes in the area
Home Values in the Area
Average Home Value in this Area
Purchase History
| Date | Buyer | Sale Price | Title Company |
|---|---|---|---|
| Watts Brenda | $70,938 | Nations Lending Services | |
| Watts Jennifer L | $122,000 | Attorney | |
| Hensley Darlene R | -- | -- | |
| Hensley Darlene R | $99,900 | -- |
Source: Public Records
Mortgage History
| Date | Status | Borrower | Loan Amount |
|---|---|---|---|
| Previous Owner | Watts Jennifer L | $117,912 | |
| Closed | Hensley Darlene R | -- |
Source: Public Records
Tax History
| Year | Tax Paid | Tax Assessment Tax Assessment Total Assessment is a certain percentage of the fair market value that is determined by local assessors to be the total taxable value of land and additions on the property. | Land | Improvement |
|---|---|---|---|---|
| 2025 | $2,571 | $51,395 | $8,887 | $42,508 |
| 2024 | $2,571 | $51,395 | $8,887 | $42,508 |
| 2023 | $2,571 | $51,395 | $8,887 | $42,508 |
| 2022 | $1,832 | $31,682 | $5,453 | $26,229 |
| 2021 | $1,830 | $31,682 | $5,453 | $26,229 |
| 2020 | $1,791 | $31,680 | $5,450 | $26,230 |
| 2019 | $2,186 | $35,030 | $6,280 | $28,750 |
| 2018 | $2,152 | $35,030 | $6,280 | $28,750 |
| 2017 | $1,919 | $35,030 | $6,280 | $28,750 |
| 2016 | $1,923 | $30,820 | $6,280 | $24,540 |
| 2015 | $1,919 | $30,820 | $6,280 | $24,540 |
| 2014 | $1,909 | $30,820 | $6,280 | $24,540 |
| 2013 | $1,850 | $30,860 | $6,280 | $24,580 |
Source: Public Records
Map
Nearby Homes
- V/L 1.16 Acres E Tuscarawas Extension
- 951 S Azalea Blvd
- 640 E Lake Ave
- 986 S Azalea Blvd
- 653 Washington Ave
- 3867 Melv St
- 611 Franklin Ave
- 2912 Clearfield Ave
- 274 E State St
- 2967 Millbrook St
- 492 E Hopocan Ave
- 536 Austin Dr Unit B
- 536 Austin Dr
- 341 6th St NE
- 1227 Flanders Ave
- 3018 Greer Rd
- 1283 S Azalea Blvd
- 244 5th St NE
- 2832 Wingate Ave
- 687 Lockwood Rd
- 701 E State St
- 731 E State St
- 714 E State St
- 704 E State St
- 741 E State St
- 3479 E Tuscarawas Extension
- 734 E State St
- 1251 Rose Circle Dr
- 751 E State St
- 680 E State St
- 746 E State St
- 671 E State St
- 887 E Tuscarawas Ave
- 876 E Tuscarawas Ave
- 761 E State St
- 760 E State St
- 3433 E Tuscarawas Extension
- 664 E State St
- 655 E State St
- 655 E State St
Your Personal Tour Guide
Ask me questions while you tour the home.