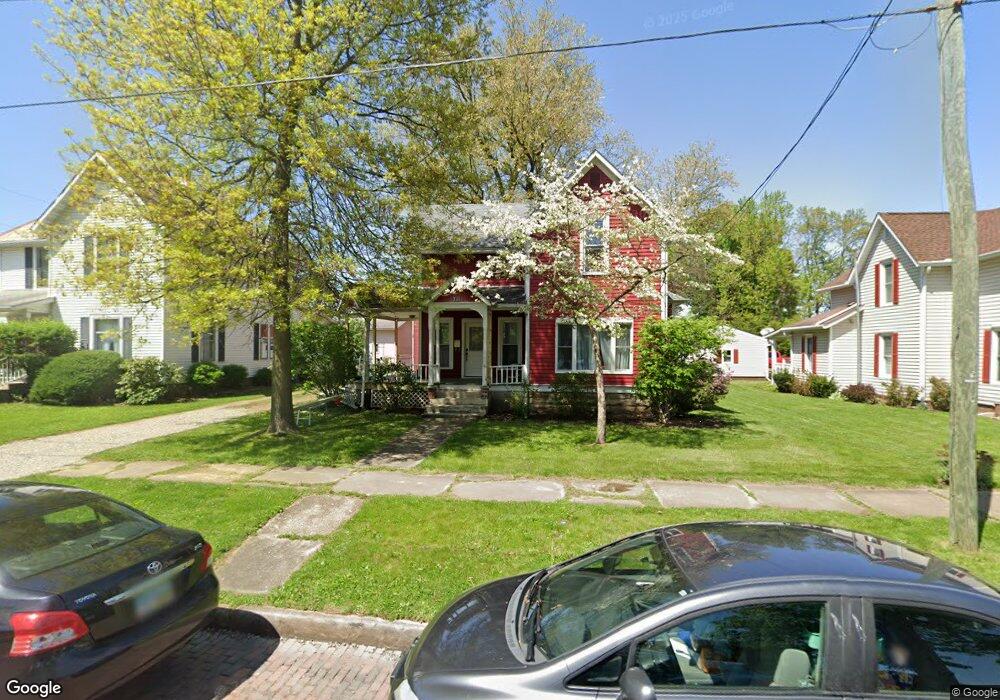
711 E Vine St Mount Vernon, OH 43050
Estimated Value: $185,000 - $250,000
3
Beds
2
Baths
1,848
Sq Ft
$121/Sq Ft
Est. Value
About This Home
This home is located at 711 E Vine St, Mount Vernon, OH 43050 and is currently estimated at $223,088, approximately $120 per square foot. 711 E Vine St is a home located in Knox County with nearby schools including Mount Vernon High School, St. Vincent de Paul School, and Christian Star Academy.
Ownership History
Date
Name
Owned For
Owner Type
Purchase Details
Closed on
Aug 19, 2025
Sold by
Bonaudi Matthew and Bonaudi Elizabeth J
Bought by
Mecabond Llc
Current Estimated Value
Purchase Details
Closed on
Sep 20, 2022
Sold by
Johns Andrew S and Johns Jennifer M
Bought by
Bonaudi Matthew and Bonaudi Elizabeth
Home Financials for this Owner
Home Financials are based on the most recent Mortgage that was taken out on this home.
Original Mortgage
$96,000
Interest Rate
5.55%
Mortgage Type
New Conventional
Purchase Details
Closed on
May 29, 1996
Sold by
Leis Steven R and Leis Christine
Bought by
Johns Andrew S and Johns Jennifer
Purchase Details
Closed on
Jun 24, 1993
Sold by
Fullington Thomas L and Fullington Isa
Bought by
Leis Steven R and Leis Christine
Purchase Details
Closed on
Jul 23, 1990
Sold by
Humbert Haas
Bought by
Fullington Thomas L and Fullington Isa
Purchase Details
Closed on
Jun 12, 1990
Sold by
Sockman Edmond E
Bought by
Humbert and Humbert Haas
Create a Home Valuation Report for This Property
The Home Valuation Report is an in-depth analysis detailing your home's value as well as a comparison with similar homes in the area
Home Values in the Area
Average Home Value in this Area
Purchase History
| Date | Buyer | Sale Price | Title Company |
|---|---|---|---|
| Mecabond Llc | -- | None Listed On Document | |
| Mecabond Llc | -- | None Listed On Document | |
| Bonaudi Matthew | $120,000 | None Listed On Document | |
| Bonaudi Matthew | $120,000 | -- | |
| Johns Andrew S | $68,000 | -- | |
| Leis Steven R | $58,500 | -- | |
| Fullington Thomas L | $45,900 | -- | |
| Humbert | $27,000 | -- |
Source: Public Records
Mortgage History
| Date | Status | Borrower | Loan Amount |
|---|---|---|---|
| Previous Owner | Bonaudi Matthew | $96,000 |
Source: Public Records
Tax History
| Year | Tax Paid | Tax Assessment Tax Assessment Total Assessment is a certain percentage of the fair market value that is determined by local assessors to be the total taxable value of land and additions on the property. | Land | Improvement |
|---|---|---|---|---|
| 2024 | $1,997 | $51,630 | $9,720 | $41,910 |
| 2023 | $2,042 | $51,630 | $9,720 | $41,910 |
| 2022 | $1,756 | $41,310 | $7,780 | $33,530 |
| 2021 | $1,756 | $41,310 | $7,780 | $33,530 |
| 2020 | $1,710 | $41,310 | $7,780 | $33,530 |
| 2019 | $1,520 | $34,280 | $10,500 | $23,780 |
| 2018 | $1,521 | $34,280 | $10,500 | $23,780 |
| 2017 | $1,493 | $34,280 | $10,500 | $23,780 |
| 2016 | $1,385 | $31,740 | $9,720 | $22,020 |
| 2015 | $1,391 | $31,740 | $9,720 | $22,020 |
| 2014 | $1,399 | $31,740 | $9,720 | $22,020 |
| 2013 | $1,447 | $31,260 | $10,100 | $21,160 |
Source: Public Records
Map
Nearby Homes
- 600 1/2 E Chestnut St
- 600 E Chestnut St Unit 1/2
- 501 Oak St
- 203 S Center St
- 604 E Gambier St
- 108 Ringold St
- 655 Howard St
- 220 Coshocton Ave
- 213 Coshocton Ave
- 900 E Gambier St
- 104 N Park St
- 418 E Pleasant St
- 6 Edgewood Blvd
- 208 E Burgess St
- 12 3rd Ave
- 12 Third Ave
- 0 Miami St
- 14 Hilltop Dr
- 22 E Gamber St
- 304 N Gay St
Your Personal Tour Guide
Ask me questions while you tour the home.