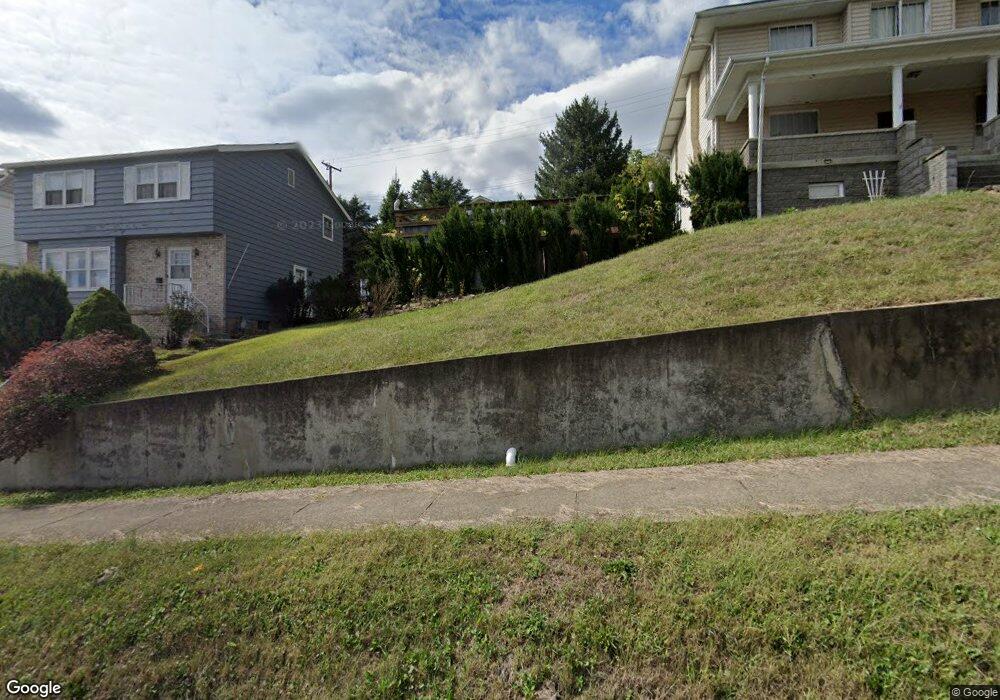
711 Elm St Martins Ferry, OH 43935
Estimated Value: $125,000 - $153,886
3
Beds
1
Bath
2,240
Sq Ft
$63/Sq Ft
Est. Value
About This Home
This home is located at 711 Elm St, Martins Ferry, OH 43935 and is currently estimated at $141,722, approximately $63 per square foot. 711 Elm St is a home located in Belmont County with nearby schools including Anna Marie Ayers Elementary School, Martins Ferry Middle School, and Martins Ferry High School.
Ownership History
Date
Name
Owned For
Owner Type
Purchase Details
Closed on
Oct 2, 2023
Sold by
Boehm Michael S and Boehm Cheryl
Bought by
Boehm Melyssa
Current Estimated Value
Home Financials for this Owner
Home Financials are based on the most recent Mortgage that was taken out on this home.
Original Mortgage
$70,000
Outstanding Balance
$68,624
Interest Rate
7.12%
Mortgage Type
New Conventional
Estimated Equity
$73,098
Purchase Details
Closed on
Aug 22, 1995
Sold by
Boehm Michael S
Bought by
Boehm Michael S
Purchase Details
Closed on
Jan 1, 1986
Sold by
Oldham Ralph W
Bought by
Oldham Ralph W
Create a Home Valuation Report for This Property
The Home Valuation Report is an in-depth analysis detailing your home's value as well as a comparison with similar homes in the area
Home Values in the Area
Average Home Value in this Area
Purchase History
| Date | Buyer | Sale Price | Title Company |
|---|---|---|---|
| Boehm Melyssa | -- | Old Republic Title | |
| Boehm Michael S | $58,000 | -- | |
| Oldham Ralph W | -- | -- |
Source: Public Records
Mortgage History
| Date | Status | Borrower | Loan Amount |
|---|---|---|---|
| Open | Boehm Melyssa | $70,000 |
Source: Public Records
Tax History Compared to Growth
Tax History
| Year | Tax Paid | Tax Assessment Tax Assessment Total Assessment is a certain percentage of the fair market value that is determined by local assessors to be the total taxable value of land and additions on the property. | Land | Improvement |
|---|---|---|---|---|
| 2024 | $2,087 | $40,560 | $2,640 | $37,920 |
| 2023 | $1,370 | $30,610 | $2,640 | $27,970 |
| 2022 | $1,370 | $30,604 | $2,639 | $27,965 |
| 2021 | $1,362 | $30,601 | $2,639 | $27,962 |
| 2020 | $1,277 | $26,610 | $2,300 | $24,310 |
| 2019 | $1,279 | $26,610 | $2,300 | $24,310 |
| 2018 | $1,310 | $26,610 | $2,300 | $24,310 |
| 2017 | $1,403 | $29,630 | $2,590 | $27,040 |
| 2016 | $1,407 | $29,630 | $2,590 | $27,040 |
| 2015 | $1,268 | $29,630 | $2,590 | $27,040 |
| 2014 | $1,100 | $25,470 | $2,360 | $23,110 |
| 2013 | $1,098 | $25,470 | $2,360 | $23,110 |
Source: Public Records
Map
Nearby Homes
- 820 Mariann Dr
- 508 Virginia St
- 839 W Vine St
- 519 Clinton St
- 527 Virginia St
- 525 S Zane Hwy
- 424 Elm St
- 805 Indiana St
- 723 Pearl St
- 722 Broadway St
- 725 S 4th St
- 916 Pearl St
- 1020 Virginia St
- 1028 Indiana St
- 1027 S Zane Hwy
- 1836 Colerain Pike
- 806 Carlisle St
- 910 Carlisle St
- 1053 Broadway St
- 0 Ferryview Rd