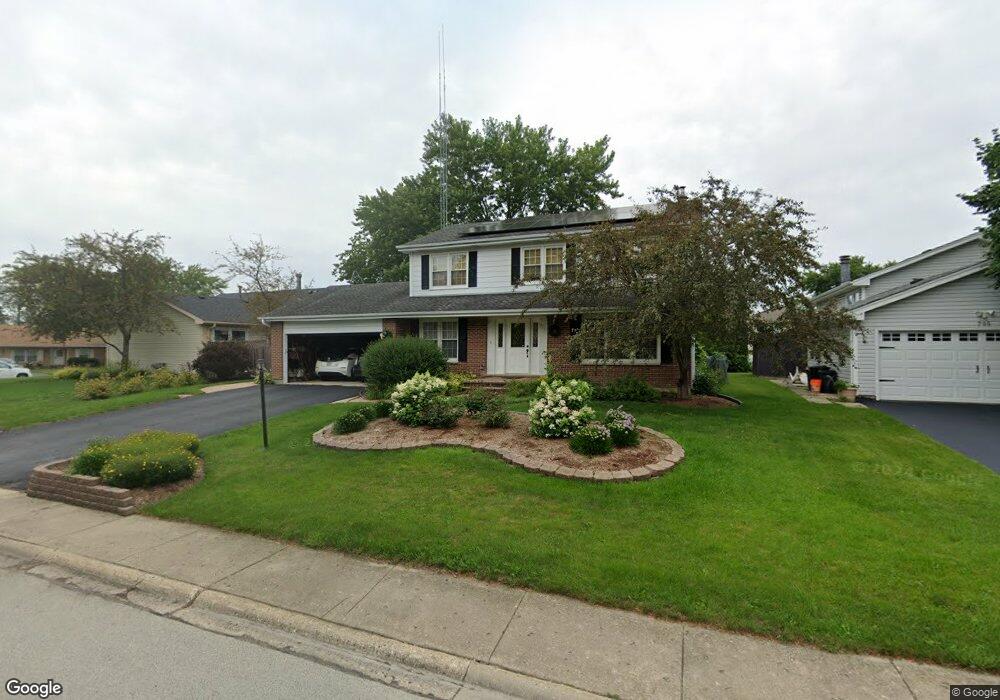
711 Fieldstone Cir Lake Zurich, IL 60047
Estimated Value: $490,000 - $663,000
5
Beds
3
Baths
2,169
Sq Ft
$248/Sq Ft
Est. Value
About This Home
This home is located at 711 Fieldstone Cir, Lake Zurich, IL 60047 and is currently estimated at $538,692, approximately $248 per square foot. 711 Fieldstone Cir is a home located in Lake County with nearby schools including Isaac Fox Elementary School, Lake Zurich Middle School - South Campus, and Lake Zurich High School.
Ownership History
Date
Name
Owned For
Owner Type
Purchase Details
Closed on
Mar 8, 2007
Sold by
Holden Linda S and Cacioppo Linda S
Bought by
Cacioppo Jeffrey P
Current Estimated Value
Purchase Details
Closed on
Nov 14, 2000
Sold by
Holden Linda S and Cacioppo Linda S
Bought by
Cacioppo Jeffrey P and Cacioppo Linda S
Home Financials for this Owner
Home Financials are based on the most recent Mortgage that was taken out on this home.
Original Mortgage
$200,000
Outstanding Balance
$73,643
Interest Rate
7.87%
Estimated Equity
$465,049
Purchase Details
Closed on
Mar 31, 1994
Sold by
Wood Richard D and Wood Sylvia J
Bought by
Holden Linda S
Home Financials for this Owner
Home Financials are based on the most recent Mortgage that was taken out on this home.
Original Mortgage
$172,350
Interest Rate
7.35%
Create a Home Valuation Report for This Property
The Home Valuation Report is an in-depth analysis detailing your home's value as well as a comparison with similar homes in the area
Home Values in the Area
Average Home Value in this Area
Purchase History
| Date | Buyer | Sale Price | Title Company |
|---|---|---|---|
| Cacioppo Jeffrey P | -- | None Available | |
| Cacioppo Jeffrey P | -- | Chicago Title Insurance Co | |
| Holden Linda S | $127,666 | -- |
Source: Public Records
Mortgage History
| Date | Status | Borrower | Loan Amount |
|---|---|---|---|
| Open | Cacioppo Jeffrey P | $200,000 | |
| Closed | Holden Linda S | $172,350 |
Source: Public Records
Tax History Compared to Growth
Tax History
| Year | Tax Paid | Tax Assessment Tax Assessment Total Assessment is a certain percentage of the fair market value that is determined by local assessors to be the total taxable value of land and additions on the property. | Land | Improvement |
|---|---|---|---|---|
| 2024 | $9,824 | $140,031 | $23,565 | $116,466 |
| 2023 | $8,850 | $133,598 | $22,482 | $111,116 |
| 2022 | $8,850 | $119,049 | $18,335 | $100,714 |
| 2021 | $8,468 | $114,361 | $17,865 | $96,496 |
| 2020 | $8,316 | $114,361 | $17,865 | $96,496 |
| 2019 | $8,189 | $113,363 | $17,709 | $95,654 |
| 2018 | $8,189 | $113,735 | $19,050 | $94,685 |
| 2017 | $8,132 | $112,364 | $18,820 | $93,544 |
| 2016 | $7,971 | $108,806 | $18,224 | $90,582 |
| 2015 | $7,854 | $103,635 | $17,358 | $86,277 |
| 2014 | $7,161 | $94,023 | $19,663 | $74,360 |
| 2012 | $7,740 | $94,220 | $19,704 | $74,516 |
Source: Public Records
Map
Nearby Homes
- 822 Woodbine Cir
- 21186 W Preserve Dr
- 20992 W Preserve Dr
- 21725 N Ashley St
- 21742 N Ashley St
- 21326 N Elder Ct
- 21704 N Pine Grove Ct
- 21355 N Bobwhite Ln
- 1202 Tracie Dr
- 815 Pheasant Ridge Dr
- 21763 Deerpath Rd
- 792 Ravenswood Ct
- 898 S Rand Rd
- 22145 W White Pine Rd
- 781 Edelweiss Dr
- 1254 Tracie Dr
- 450 Trailside Dr
- 23036 W Long Grove Rd
- 1148 Oxford Ln
- 20688 N Oliver Ct
- 705 Fieldstone Cir
- 715 Fieldstone Cir
- 701 Deerchase Rd
- 721 Deerchase Rd
- 712 Fieldstone Cir
- 710 Fieldstone Cir
- 714 Fieldstone Cir
- 702 Fieldstone Cir
- 722 Fieldstone Cir
- 704 Fieldstone Cir
- 708 Fieldstone Cir
- 720 Fieldstone Cir
- 716 Fieldstone Cir
- 700 Fieldstone Cir
- 724 Fieldstone Cir
- 825 Woodbine Cir
- 801 Woodbine Cir
- 706 Fieldstone Cir
- 718 Fieldstone Cir
- 1394 Coral Reef Way