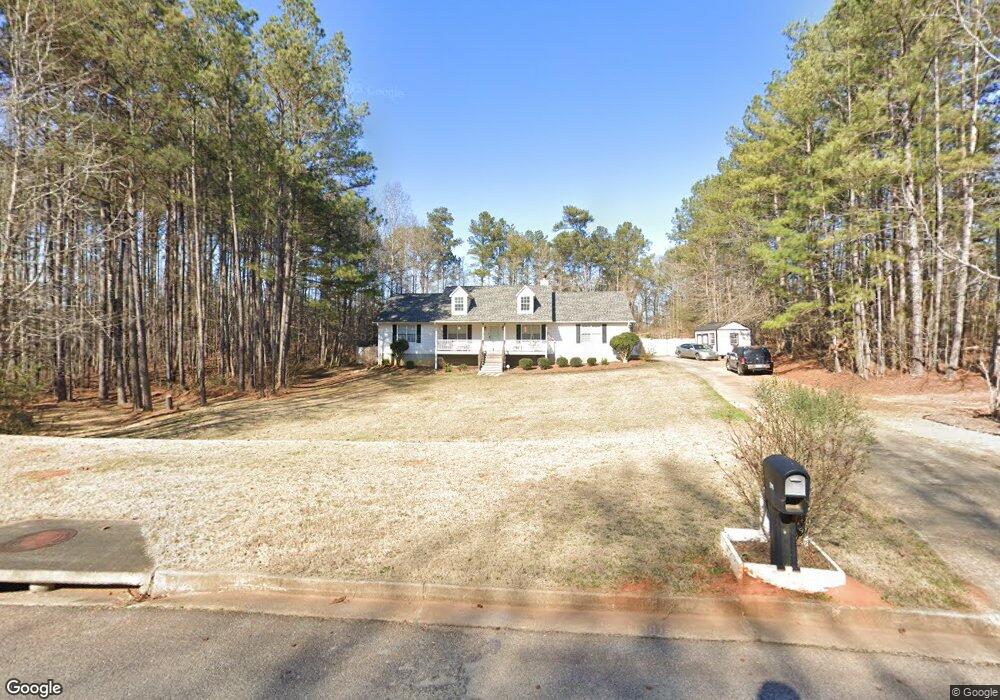
711 Grove Pointe Cir Locust Grove, GA 30248
Estimated Value: $296,000 - $312,000
4
Beds
2
Baths
2,120
Sq Ft
$144/Sq Ft
Est. Value
About This Home
This home is located at 711 Grove Pointe Cir, Locust Grove, GA 30248 and is currently estimated at $305,302, approximately $144 per square foot. 711 Grove Pointe Cir is a home located in Henry County with nearby schools including Locust Grove Elementary School, Locust Grove Middle School, and Locust Grove High School.
Ownership History
Date
Name
Owned For
Owner Type
Purchase Details
Closed on
Jun 15, 2018
Sold by
Hampton Jason
Bought by
Shorter Virgil D
Current Estimated Value
Home Financials for this Owner
Home Financials are based on the most recent Mortgage that was taken out on this home.
Original Mortgage
$171,830
Outstanding Balance
$148,937
Interest Rate
4.6%
Mortgage Type
FHA
Estimated Equity
$156,365
Purchase Details
Closed on
May 1, 2001
Sold by
Stockbridge Homes Inc
Bought by
Hampton Jason L and Hampton Audrey M
Home Financials for this Owner
Home Financials are based on the most recent Mortgage that was taken out on this home.
Original Mortgage
$109,700
Interest Rate
11%
Mortgage Type
New Conventional
Create a Home Valuation Report for This Property
The Home Valuation Report is an in-depth analysis detailing your home's value as well as a comparison with similar homes in the area
Home Values in the Area
Average Home Value in this Area
Purchase History
| Date | Buyer | Sale Price | Title Company |
|---|---|---|---|
| Shorter Virgil D | $175,000 | -- | |
| Hampton Jason | -- | -- | |
| Hampton Jason L | $121,900 | -- |
Source: Public Records
Mortgage History
| Date | Status | Borrower | Loan Amount |
|---|---|---|---|
| Open | Hampton Jason | $171,830 | |
| Closed | Shorter Virgil D | $171,830 | |
| Previous Owner | Hampton Jason L | $109,700 |
Source: Public Records
Tax History Compared to Growth
Tax History
| Year | Tax Paid | Tax Assessment Tax Assessment Total Assessment is a certain percentage of the fair market value that is determined by local assessors to be the total taxable value of land and additions on the property. | Land | Improvement |
|---|---|---|---|---|
| 2025 | $3,519 | $126,244 | $14,000 | $112,244 |
| 2024 | $3,519 | $117,960 | $14,000 | $103,960 |
| 2023 | $3,241 | $125,560 | $14,000 | $111,560 |
| 2022 | $3,230 | $103,680 | $14,000 | $89,680 |
| 2021 | $2,818 | $86,160 | $14,000 | $72,160 |
| 2020 | $2,698 | $80,880 | $12,000 | $68,880 |
| 2019 | $2,432 | $70,000 | $11,130 | $58,870 |
| 2018 | $2,694 | $69,200 | $10,800 | $58,400 |
| 2016 | $2,573 | $66,040 | $10,000 | $56,040 |
| 2015 | -- | $50,000 | $8,000 | $42,000 |
| 2014 | $1,761 | $43,000 | $8,000 | $35,000 |
Source: Public Records
Map
Nearby Homes
- 703 Grove Pointe Cir
- 121 Jaley Pkwy
- 620 Grove Pointe Way
- 213 Umber Rd
- 413 Atlas Ct
- 212 Umber Rd
- 208 Umber Rd
- 533 Grove Pointe Ct Unit 1
- 425 Bell Flower Trail
- 380 Higgins Rd
- Avion Plan at Bridle Creek
- Elle Plan at Bridle Creek
- 65 Weymouth Dr
- Halton Plan at Bridle Creek
- 632 Kimberwick Dr
- Mansfield Plan at Bridle Creek
- Denton Plan at Bridle Creek
- Hanover Plan at Bridle Creek
- 704 Curb Ct
- 73 Weymouth Dr
- 709 Grove Pointe Cir Unit 5
- 709 Grove Pointe Cir
- 709 Grove Pointe Cir
- 713 Grove Pointe Cir Unit 2
- 710 Grove Pointe Cir
- 707 Grove Pointe Cir
- 0 Grove Pointe Cir Unit 8373269
- 0 Grove Pointe Cir Unit 3280227
- 0 Grove Pointe Cir Unit 7030639
- 0 Grove Pointe Cir Unit 7047431
- 0 Grove Pointe Cir
- 714 Grove Pointe Cir
- 714 Grove Pointe Cir
- 706 Grove Pointe Cir
- 706 Grove Pointe Cir Unit 2
- 715 Grove Pointe Cir
- 703 Grove Point
- 400 Grove Pointe Ct
- 716 Grove Pointe Cir Unit 2
- 705 Grove Point Unit 3