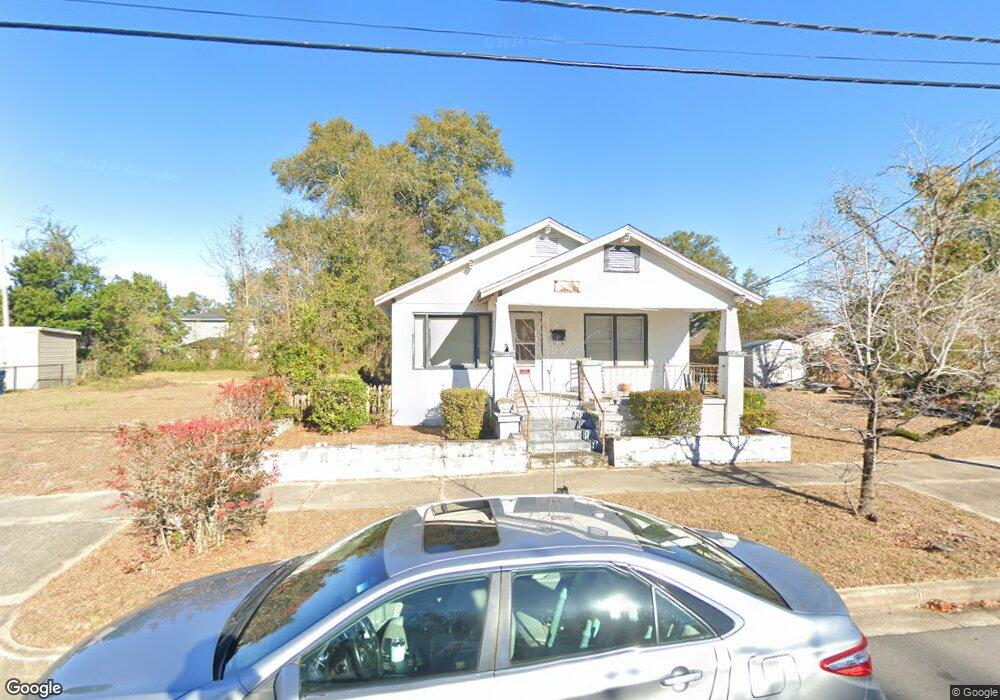
711 Harnett St Wilmington, NC 28401
Northside NeighborhoodEstimated Value: $283,999 - $346,000
3
Beds
1
Bath
1,040
Sq Ft
$294/Sq Ft
Est. Value
About This Home
This home is located at 711 Harnett St, Wilmington, NC 28401 and is currently estimated at $306,000, approximately $294 per square foot. 711 Harnett St is a home located in New Hanover County with nearby schools including Snipes Academy of Arts & Design, Williston Middle School, and New Hanover High School.
Ownership History
Date
Name
Owned For
Owner Type
Purchase Details
Closed on
May 29, 2025
Sold by
Pridgen Shirley Green and Pridgen Garry Connel
Bought by
Green Kimbley
Current Estimated Value
Purchase Details
Closed on
Feb 20, 2001
Sold by
Lewis Hattie B
Bought by
Lewis Hattie Hrs
Purchase Details
Closed on
Oct 21, 1994
Sold by
Lewis James and Lewis Lewis
Bought by
Lewis Hattie B
Purchase Details
Closed on
Jul 10, 1967
Sold by
Retchin Raymond Ida S
Bought by
Lewis James O Hattie B
Create a Home Valuation Report for This Property
The Home Valuation Report is an in-depth analysis detailing your home's value as well as a comparison with similar homes in the area
Home Values in the Area
Average Home Value in this Area
Purchase History
| Date | Buyer | Sale Price | Title Company |
|---|---|---|---|
| Green Kimbley | -- | None Listed On Document | |
| Green Kimbley | -- | None Listed On Document | |
| Lewis Hattie Hrs | -- | -- | |
| Lewis Hattie B | -- | -- | |
| Lewis James O Hattie B | -- | -- |
Source: Public Records
Tax History Compared to Growth
Tax History
| Year | Tax Paid | Tax Assessment Tax Assessment Total Assessment is a certain percentage of the fair market value that is determined by local assessors to be the total taxable value of land and additions on the property. | Land | Improvement |
|---|---|---|---|---|
| 2024 | $1,525 | $175,300 | $47,100 | $128,200 |
| 2023 | $1,525 | $175,300 | $47,100 | $128,200 |
| 2022 | $1,490 | $175,300 | $47,100 | $128,200 |
| 2021 | $1,500 | $175,300 | $47,100 | $128,200 |
| 2020 | $628 | $59,600 | $28,300 | $31,300 |
| 2019 | $628 | $59,600 | $28,300 | $31,300 |
| 2018 | $628 | $59,600 | $28,300 | $31,300 |
| 2017 | $628 | $59,600 | $28,300 | $31,300 |
| 2016 | $897 | $81,000 | $28,500 | $52,500 |
| 2015 | $858 | $81,000 | $28,500 | $52,500 |
| 2014 | $821 | $81,000 | $28,500 | $52,500 |
Source: Public Records
Map
Nearby Homes