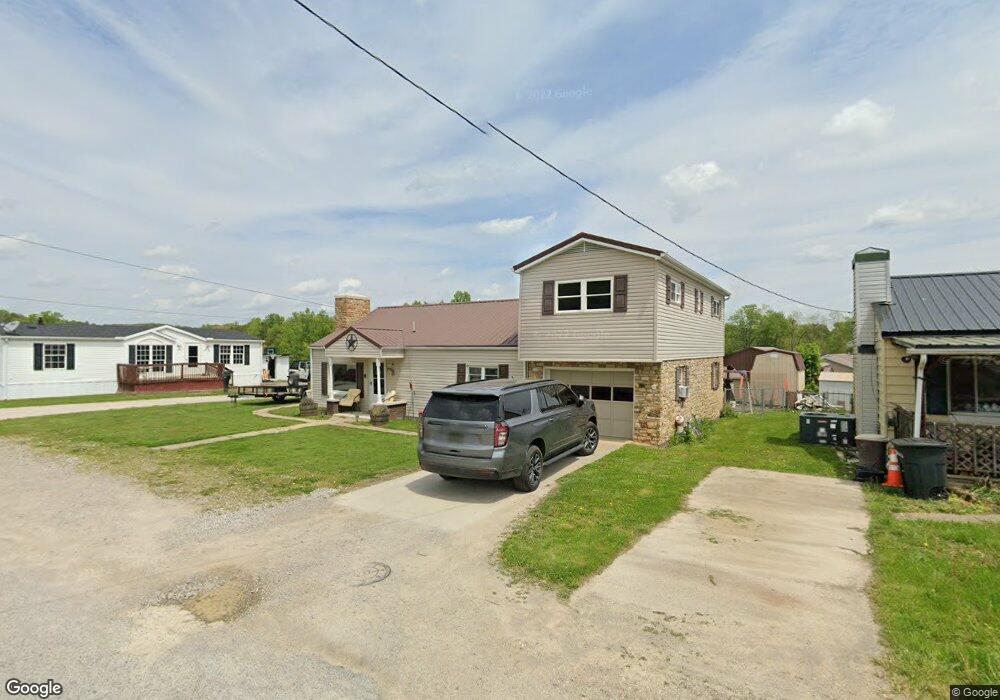
711 High St Saint Albans, WV 25177
Estimated Value: $152,000 - $233,000
4
Beds
2
Baths
1,840
Sq Ft
$103/Sq Ft
Est. Value
About This Home
This home is located at 711 High St, Saint Albans, WV 25177 and is currently estimated at $189,245, approximately $102 per square foot. 711 High St is a home located in Kanawha County with nearby schools including Anne Bailey Elementary School, Hayes Middle School, and Saint Albans High School.
Ownership History
Date
Name
Owned For
Owner Type
Purchase Details
Closed on
Feb 4, 2015
Sold by
Morris Gary L
Bought by
Payne David R
Current Estimated Value
Home Financials for this Owner
Home Financials are based on the most recent Mortgage that was taken out on this home.
Original Mortgage
$61,200
Outstanding Balance
$47,013
Interest Rate
3.84%
Mortgage Type
New Conventional
Estimated Equity
$142,232
Purchase Details
Closed on
Aug 4, 1999
Sold by
Morris Rome W
Bought by
Morris Gary L
Home Financials for this Owner
Home Financials are based on the most recent Mortgage that was taken out on this home.
Original Mortgage
$6,425
Interest Rate
7.65%
Mortgage Type
Purchase Money Mortgage
Create a Home Valuation Report for This Property
The Home Valuation Report is an in-depth analysis detailing your home's value as well as a comparison with similar homes in the area
Home Values in the Area
Average Home Value in this Area
Purchase History
| Date | Buyer | Sale Price | Title Company |
|---|---|---|---|
| Payne David R | $50,000 | -- | |
| Morris Gary L | $45,000 | -- |
Source: Public Records
Mortgage History
| Date | Status | Borrower | Loan Amount |
|---|---|---|---|
| Open | Payne David R | $61,200 | |
| Previous Owner | Morris Gary L | $6,425 |
Source: Public Records
Tax History Compared to Growth
Tax History
| Year | Tax Paid | Tax Assessment Tax Assessment Total Assessment is a certain percentage of the fair market value that is determined by local assessors to be the total taxable value of land and additions on the property. | Land | Improvement |
|---|---|---|---|---|
| 2024 | $1,038 | $84,060 | $11,100 | $72,960 |
| 2023 | $1,000 | $79,380 | $11,100 | $68,280 |
| 2022 | $958 | $76,080 | $11,100 | $64,980 |
| 2021 | $967 | $76,740 | $11,100 | $65,640 |
| 2020 | $968 | $76,860 | $11,100 | $65,760 |
| 2019 | $911 | $72,300 | $11,100 | $61,200 |
| 2018 | $811 | $72,420 | $11,100 | $61,320 |
| 2017 | $820 | $73,080 | $11,100 | $61,980 |
| 2016 | $713 | $63,420 | $11,100 | $52,320 |
| 2015 | $712 | $63,420 | $11,100 | $52,320 |
| 2014 | $700 | $63,420 | $11,100 | $52,320 |
Source: Public Records
Map
Nearby Homes