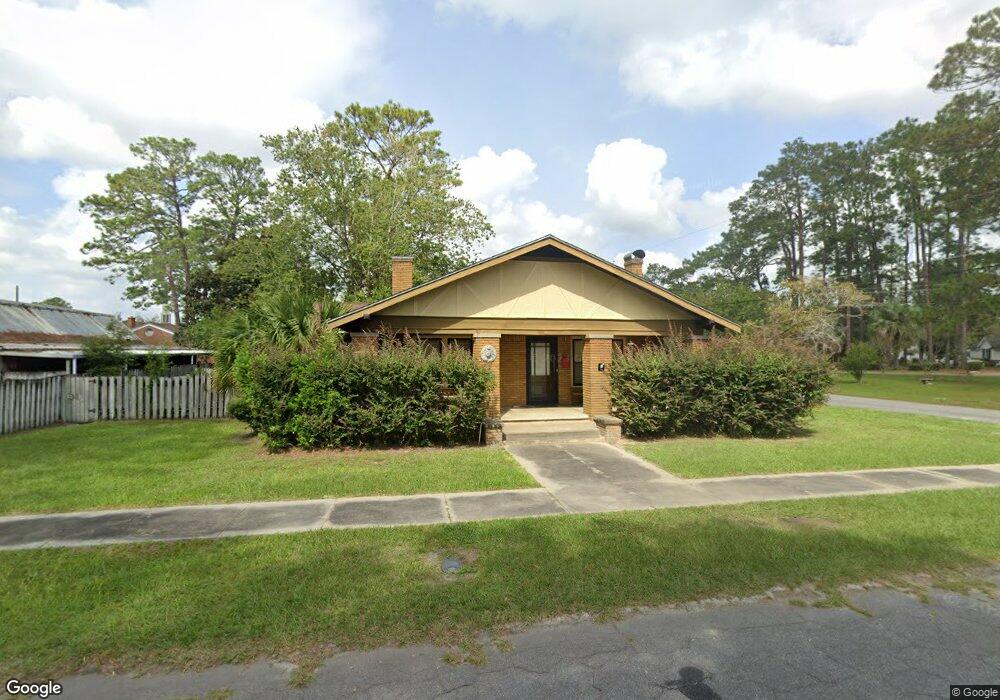
711 Holly St Waycross, GA 31501
Estimated Value: $186,000 - $242,000
3
Beds
3
Baths
2,475
Sq Ft
$88/Sq Ft
Est. Value
About This Home
This home is located at 711 Holly St, Waycross, GA 31501 and is currently estimated at $217,020, approximately $87 per square foot. 711 Holly St is a home located in Ware County with nearby schools including Williams Heights Elementary School, Waycross Middle School, and Ware County High School.
Ownership History
Date
Name
Owned For
Owner Type
Purchase Details
Closed on
May 21, 2024
Sold by
Moreno Bennett Elisa Maria
Bought by
Jewell Felicia Marie
Current Estimated Value
Home Financials for this Owner
Home Financials are based on the most recent Mortgage that was taken out on this home.
Original Mortgage
$173,992
Outstanding Balance
$171,909
Interest Rate
7.7%
Mortgage Type
FHA
Estimated Equity
$45,111
Purchase Details
Closed on
Feb 25, 2013
Sold by
Bennett Elisa Maria Moreno
Bought by
Bennett Elisa Mario Moreno and Bennett Richard W
Purchase Details
Closed on
Dec 4, 2012
Sold by
Thrift Elizabeth V
Bought by
Bennett Elisa Maria Moreno
Home Financials for this Owner
Home Financials are based on the most recent Mortgage that was taken out on this home.
Original Mortgage
$75,920
Interest Rate
3.43%
Mortgage Type
New Conventional
Purchase Details
Closed on
Nov 3, 1987
Create a Home Valuation Report for This Property
The Home Valuation Report is an in-depth analysis detailing your home's value as well as a comparison with similar homes in the area
Home Values in the Area
Average Home Value in this Area
Purchase History
| Date | Buyer | Sale Price | Title Company |
|---|---|---|---|
| Jewell Felicia Marie | $180,000 | -- | |
| Jewell Felicia Marie | $180,000 | -- | |
| Bennett Elisa Mario Moreno | -- | -- | |
| Bennett Elisa Maria Moreno | $94,900 | -- | |
| -- | -- | -- |
Source: Public Records
Mortgage History
| Date | Status | Borrower | Loan Amount |
|---|---|---|---|
| Open | Jewell Felicia Marie | $173,992 | |
| Closed | Jewell Felicia Marie | $173,992 | |
| Previous Owner | Bennett Elisa Maria Moreno | $75,920 |
Source: Public Records
Tax History Compared to Growth
Tax History
| Year | Tax Paid | Tax Assessment Tax Assessment Total Assessment is a certain percentage of the fair market value that is determined by local assessors to be the total taxable value of land and additions on the property. | Land | Improvement |
|---|---|---|---|---|
| 2024 | $4,096 | $101,900 | $3,200 | $98,700 |
| 2023 | $3,462 | $63,004 | $2,632 | $60,372 |
| 2022 | $2,453 | $63,004 | $2,632 | $60,372 |
| 2021 | $2,201 | $52,362 | $2,632 | $49,730 |
| 2020 | $1,903 | $45,128 | $2,632 | $42,496 |
| 2019 | $1,864 | $43,621 | $2,632 | $40,989 |
| 2018 | $1,814 | $42,114 | $2,632 | $39,482 |
| 2017 | $1,771 | $42,114 | $2,632 | $39,482 |
| 2016 | $1,771 | $42,114 | $2,632 | $39,482 |
| 2015 | $1,783 | $42,114 | $2,632 | $39,482 |
| 2014 | $1,781 | $42,114 | $2,632 | $39,482 |
| 2013 | -- | $37,291 | $2,631 | $34,660 |
Source: Public Records
Map
Nearby Homes
- 506 Magnolia Dr
- 808 Satilla Blvd
- 511 Richmond Ave
- 1101 Cherokee Dr
- 807 College St
- 713 Magnolia Dr
- 415 Dewey St
- 502 Dewey St
- 0 Goodwin St
- 924 Highsmith St
- 707 Euclid Ave
- 0 Saint Marys Dr Unit (TRACT 2 0.25 ACRES)
- 903 Atlantic Ave
- 907 Euclid Ave
- 1100 Atlantic Ave
- 1405 Grove Ave
- 1701 Satilla Blvd
- 1205 Dean Dr
- 706 Cherokee Cir
- 301 Riverside Dr
- 704 Magnolia St
- 708 Holly St
- 706 Holly St
- 701 Holly St
- 702 Holly St
- 702 Magnolia St
- 700 Holly St
- 709 Laurel St
- 801 Magnolia St
- 801 Laurel St
- 701 Laurel St
- 803 Magnolia St
- 500 Magnolia Dr
- 609 Holly St
- 0 Forrest Ave Unit 7463814
- 0 Forrest Ave Unit 7488858
- 0 Forrest Ave
- 608 Magnolia St
- 805 Magnolia St
- 608 Holly St