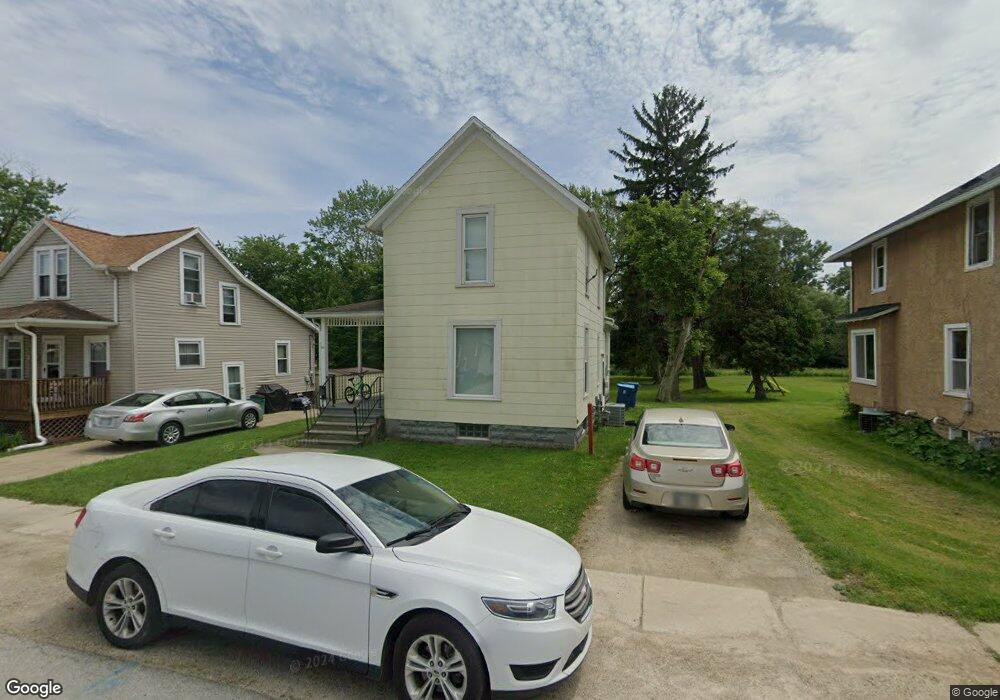
711 June St Fremont, OH 43420
Estimated Value: $104,443 - $134,000
2
Beds
1
Bath
954
Sq Ft
$126/Sq Ft
Est. Value
About This Home
This home is located at 711 June St, Fremont, OH 43420 and is currently estimated at $120,361, approximately $126 per square foot. 711 June St is a home located in Sandusky County with nearby schools including Fremont Ross High School, St. Joseph School, and Bishop Hoffman Catholic School - This is St Joe's School now.
Ownership History
Date
Name
Owned For
Owner Type
Purchase Details
Closed on
Dec 8, 2008
Sold by
Guaranty Bank
Bought by
Abdoo Enterprises Limited
Current Estimated Value
Home Financials for this Owner
Home Financials are based on the most recent Mortgage that was taken out on this home.
Original Mortgage
$21,500
Outstanding Balance
$14,454
Interest Rate
6.49%
Mortgage Type
Future Advance Clause Open End Mortgage
Estimated Equity
$105,907
Purchase Details
Closed on
Apr 22, 2008
Sold by
Dicker Angela S
Bought by
Guaranty Bank
Purchase Details
Closed on
Mar 13, 2002
Sold by
Hufford C Richard
Bought by
Dicker Angie S Wettrick Joshua
Home Financials for this Owner
Home Financials are based on the most recent Mortgage that was taken out on this home.
Original Mortgage
$32,500
Interest Rate
8.5%
Mortgage Type
New Conventional
Purchase Details
Closed on
May 1, 1994
Bought by
Abdoo Enterprises Limited
Create a Home Valuation Report for This Property
The Home Valuation Report is an in-depth analysis detailing your home's value as well as a comparison with similar homes in the area
Home Values in the Area
Average Home Value in this Area
Purchase History
| Date | Buyer | Sale Price | Title Company |
|---|---|---|---|
| Abdoo Enterprises Limited | $18,000 | First American Title | |
| Guaranty Bank | $32,000 | Ohio Title | |
| Dicker Angie S Wettrick Joshua | $42,500 | -- | |
| Abdoo Enterprises Limited | $27,000 | -- |
Source: Public Records
Mortgage History
| Date | Status | Borrower | Loan Amount |
|---|---|---|---|
| Open | Abdoo Enterprises Limited | $21,500 | |
| Previous Owner | Dicker Angie S Wettrick Joshua | $32,500 |
Source: Public Records
Tax History Compared to Growth
Tax History
| Year | Tax Paid | Tax Assessment Tax Assessment Total Assessment is a certain percentage of the fair market value that is determined by local assessors to be the total taxable value of land and additions on the property. | Land | Improvement |
|---|---|---|---|---|
| 2024 | $1,251 | $25,900 | $6,440 | $19,460 |
| 2023 | $1,251 | $20,550 | $5,110 | $15,440 |
| 2022 | $814 | $20,550 | $5,110 | $15,440 |
| 2021 | $840 | $20,550 | $5,110 | $15,440 |
| 2020 | $697 | $16,800 | $5,110 | $11,690 |
| 2019 | $696 | $16,800 | $5,110 | $11,690 |
| 2018 | $687 | $16,800 | $5,110 | $11,690 |
| 2017 | $677 | $16,240 | $5,110 | $11,130 |
| 2016 | $595 | $16,240 | $5,110 | $11,130 |
| 2015 | $586 | $16,240 | $5,110 | $11,130 |
| 2014 | $570 | $15,060 | $5,150 | $9,910 |
| 2013 | $557 | $15,060 | $5,150 | $9,910 |
Source: Public Records
Map
Nearby Homes
- 625 Bush Place
- 815 South St
- 616 S Wood St
- 905 Twinn St
- 1028 June St
- 1013 Whittlesey St
- 619 Hayes Ave
- 515 S Arch St
- 1015 Hayes Ave
- 1037 Buckland Ave
- 1342 Mcpherson Blvd
- 1485 Autumn Woods Dr
- 1611 Mcpherson Blvd
- 880 Cleveland Ave
- 1009 Napoleon St
- 208 E State St
- 600 S Buchanan St
- 0 S Buchanan St
- 64 River Run Dr Unit J
- 427 N Clover St