Estimated Value: $208,000 - $254,000
3
Beds
2
Baths
1,725
Sq Ft
$136/Sq Ft
Est. Value
About This Home
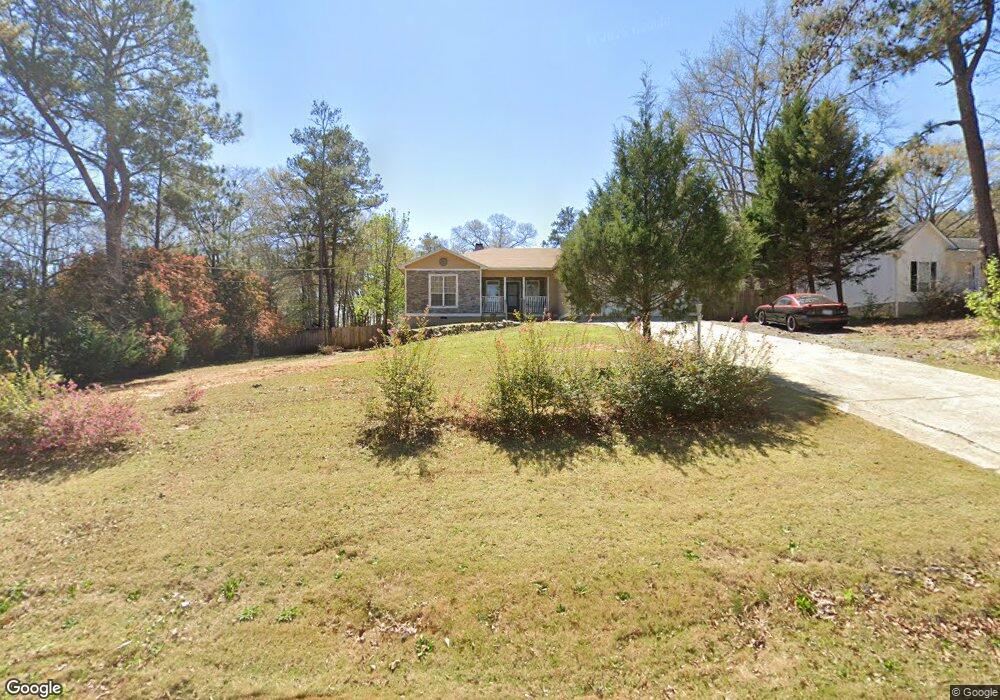
This home is located at 711 Main St Unit 6, Byron, GA 31008 and is currently estimated at $234,820, approximately $136 per square foot. 711 Main St Unit 6 is a home located in Peach County with nearby schools including Byron Elementary School, Byron Middle School, and Peach County High School.
Ownership History
Date
Name
Owned For
Owner Type
Purchase Details
Closed on
Aug 28, 2020
Sold by
Wells Fargo Bank Na
Bought by
Concepcion Yabel and Concepcion Lisette Marcelina
Current Estimated Value
Purchase Details
Closed on
Oct 1, 2019
Sold by
Mills William F
Bought by
Wells Fargo Bank Na
Purchase Details
Closed on
May 11, 2012
Sold by
Gadbois George F
Bought by
Mills William F
Home Financials for this Owner
Home Financials are based on the most recent Mortgage that was taken out on this home.
Original Mortgage
$112,244
Interest Rate
3.91%
Mortgage Type
New Conventional
Purchase Details
Closed on
Dec 24, 2002
Sold by
Hamilton Rebecca
Bought by
Gadbois George F
Purchase Details
Closed on
Nov 1, 1996
Bought by
Gadbois George F
Purchase Details
Closed on
Sep 4, 1992
Bought by
Mcghee Reginald G
Purchase Details
Closed on
Mar 29, 1991
Bought by
Blando Shirley
Create a Home Valuation Report for This Property
The Home Valuation Report is an in-depth analysis detailing your home's value as well as a comparison with similar homes in the area
Home Values in the Area
Average Home Value in this Area
Purchase History
| Date | Buyer | Sale Price | Title Company |
|---|---|---|---|
| Concepcion Yabel | $87,000 | -- | |
| Wells Fargo Bank Na | $102,592 | -- | |
| Mills William F | $110,000 | -- | |
| Gadbois George F | -- | -- | |
| Gadbois George F | $89,900 | -- | |
| Mcghee Reginald G | $77,000 | -- | |
| Blando Shirley | -- | -- |
Source: Public Records
Mortgage History
| Date | Status | Borrower | Loan Amount |
|---|---|---|---|
| Previous Owner | Mills William F | $112,244 |
Source: Public Records
Tax History Compared to Growth
Tax History
| Year | Tax Paid | Tax Assessment Tax Assessment Total Assessment is a certain percentage of the fair market value that is determined by local assessors to be the total taxable value of land and additions on the property. | Land | Improvement |
|---|---|---|---|---|
| 2024 | $2,153 | $61,840 | $7,000 | $54,840 |
| 2023 | $1,018 | $58,160 | $5,600 | $52,560 |
| 2022 | $1,320 | $51,040 | $5,600 | $45,440 |
| 2021 | $1,024 | $44,680 | $5,600 | $39,080 |
| 2020 | $1,480 | $47,400 | $5,600 | $41,800 |
| 2019 | $1,487 | $47,400 | $5,600 | $41,800 |
| 2018 | $1,495 | $47,400 | $5,600 | $41,800 |
| 2017 | $1,502 | $47,400 | $5,600 | $41,800 |
| 2016 | $1,496 | $47,400 | $5,600 | $41,800 |
| 2015 | $1,498 | $47,400 | $5,600 | $41,800 |
| 2014 | $1,500 | $47,400 | $5,600 | $41,800 |
| 2013 | -- | $47,400 | $5,600 | $41,800 |
Source: Public Records
Map
Nearby Homes
- 101 Fawn Ct
- 103 Fawn Ct
- 506 Howard St
- 102 Silver Maple Ct
- 107 Silver Maple Ct
- 109 Silver Maple Ct
- 119 Buckskin Trail
- 125 Buckskin Trail
- 350 Georgia 42
- 104 Robinson St
- 203 Colonial Dr
- 0 Moseley Rd Unit 10582548
- 0 Moseley Rd Unit 255314
- 0 Moseley Rd Unit 180905
- 00 Georgia 49
- 208 Crystal Dr
- 0 Highway 42 Unit 10576098
- 467 Kirkland Dr
- 113 Sweetspire Ln