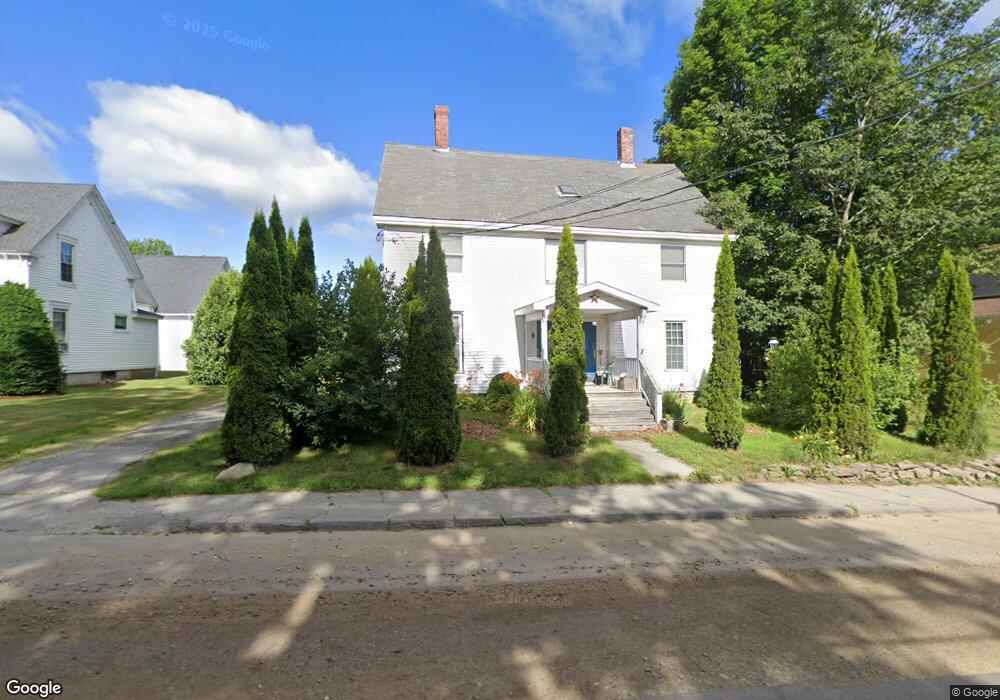
711 Main St Monmouth, ME 04259
Estimated Value: $396,000 - $589,000
7
Beds
3
Baths
4,425
Sq Ft
$111/Sq Ft
Est. Value
About This Home
This home is located at 711 Main St, Monmouth, ME 04259 and is currently estimated at $492,500, approximately $111 per square foot. 711 Main St is a home located in Kennebec County with nearby schools including Hall-Dale Elementary School, Marcia Buker School, and Dresden Elementary School.
Ownership History
Date
Name
Owned For
Owner Type
Purchase Details
Closed on
Aug 9, 2010
Sold by
Us Bank Na
Bought by
Fernandez Hector J
Current Estimated Value
Purchase Details
Closed on
May 28, 2010
Sold by
Hinkley Ronald
Bought by
Us Bank Na
Purchase Details
Closed on
Aug 2, 2005
Sold by
Parsons Allan D and Parsons Paula R
Bought by
Hinkley Rebecca
Home Financials for this Owner
Home Financials are based on the most recent Mortgage that was taken out on this home.
Original Mortgage
$143,685
Interest Rate
7%
Mortgage Type
Commercial
Create a Home Valuation Report for This Property
The Home Valuation Report is an in-depth analysis detailing your home's value as well as a comparison with similar homes in the area
Home Values in the Area
Average Home Value in this Area
Purchase History
| Date | Buyer | Sale Price | Title Company |
|---|---|---|---|
| Fernandez Hector J | -- | -- | |
| Us Bank Na | -- | -- | |
| Hinkley Rebecca | -- | -- |
Source: Public Records
Mortgage History
| Date | Status | Borrower | Loan Amount |
|---|---|---|---|
| Previous Owner | Hinkley Rebecca | $143,685 |
Source: Public Records
Tax History Compared to Growth
Tax History
| Year | Tax Paid | Tax Assessment Tax Assessment Total Assessment is a certain percentage of the fair market value that is determined by local assessors to be the total taxable value of land and additions on the property. | Land | Improvement |
|---|---|---|---|---|
| 2024 | $5,147 | $251,700 | $38,200 | $213,500 |
| 2023 | $4,556 | $251,700 | $38,200 | $213,500 |
| 2022 | $4,269 | $218,900 | $33,200 | $185,700 |
| 2021 | $4,115 | $218,900 | $33,200 | $185,700 |
| 2020 | $3,973 | $218,900 | $33,200 | $185,700 |
| 2018 | $3,842 | $218,900 | $33,200 | $185,700 |
| 2017 | $3,842 | $218,900 | $33,200 | $185,700 |
| 2016 | $3,633 | $219,500 | $33,000 | $186,500 |
| 2015 | $3,424 | $219,500 | $33,000 | $186,500 |
| 2013 | $3,642 | $250,300 | $33,000 | $217,300 |
Source: Public Records
Map
Nearby Homes
- 723 Main St
- 745 Main St
- 18 Gray Mill Rd
- 256 Blue Rd
- 297 Norris Hill Rd
- 3 Ridge Rd
- 15 Blue Rock Rd Unit 26
- 15 Blue Rock Rd Unit 24
- 15 Blue Rock Rd Unit 34
- 51 Sandy Dr
- 33 Sandy Dr
- 35002 Waugan Rd
- 25 Hansons Wood Rd
- 200 Back St
- 61 Highland Terrace
- 147 N Main St
- 11 Neal Ln
- 57 Neal Ln
- 83 Larry Dr
- 34 Gerber Ln