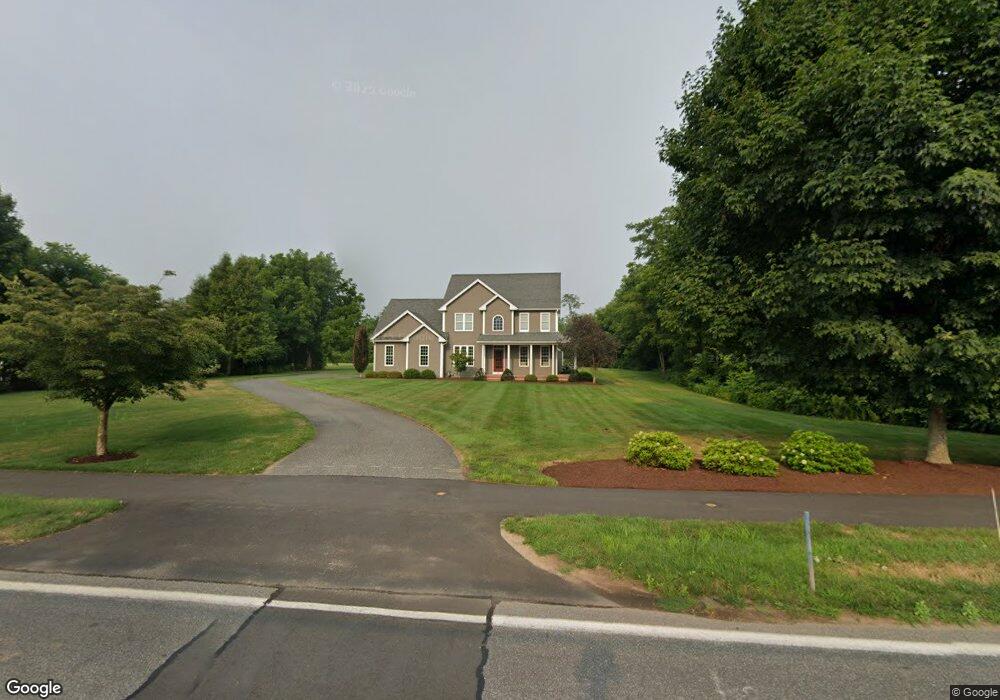
711 Main St Wilbraham, MA 01095
Estimated Value: $611,535 - $698,000
4
Beds
3
Baths
2,516
Sq Ft
$261/Sq Ft
Est. Value
About This Home
This home is located at 711 Main St, Wilbraham, MA 01095 and is currently estimated at $656,884, approximately $261 per square foot. 711 Main St is a home located in Hampden County with nearby schools including Minnechaug Regional High School, Springfield International Charter School, and Wilbraham & Monson Academy.
Ownership History
Date
Name
Owned For
Owner Type
Purchase Details
Closed on
Aug 1, 2002
Sold by
Keiser John M and Keiser Peter B
Bought by
Balise Thomas W and Meredith Balise J
Current Estimated Value
Home Financials for this Owner
Home Financials are based on the most recent Mortgage that was taken out on this home.
Original Mortgage
$81,000
Outstanding Balance
$34,496
Interest Rate
6.64%
Mortgage Type
Purchase Money Mortgage
Estimated Equity
$622,388
Create a Home Valuation Report for This Property
The Home Valuation Report is an in-depth analysis detailing your home's value as well as a comparison with similar homes in the area
Home Values in the Area
Average Home Value in this Area
Purchase History
| Date | Buyer | Sale Price | Title Company |
|---|---|---|---|
| Balise Thomas W | $90,000 | -- |
Source: Public Records
Mortgage History
| Date | Status | Borrower | Loan Amount |
|---|---|---|---|
| Open | Balise Thomas W | $81,000 |
Source: Public Records
Tax History Compared to Growth
Tax History
| Year | Tax Paid | Tax Assessment Tax Assessment Total Assessment is a certain percentage of the fair market value that is determined by local assessors to be the total taxable value of land and additions on the property. | Land | Improvement |
|---|---|---|---|---|
| 2025 | $10,104 | $565,100 | $101,100 | $464,000 |
| 2024 | $10,051 | $543,300 | $101,100 | $442,200 |
| 2023 | $8,936 | $486,600 | $101,100 | $385,500 |
| 2022 | $8,936 | $436,100 | $101,100 | $335,000 |
| 2021 | $9,765 | $425,300 | $106,300 | $319,000 |
| 2020 | $9,518 | $425,300 | $106,300 | $319,000 |
| 2019 | $9,272 | $425,300 | $106,300 | $319,000 |
| 2018 | $9,201 | $406,400 | $106,300 | $300,100 |
| 2017 | $8,941 | $406,400 | $106,300 | $300,100 |
| 2016 | $8,348 | $386,500 | $116,800 | $269,700 |
| 2015 | $8,070 | $386,500 | $116,800 | $269,700 |
Source: Public Records
Map
Nearby Homes
- 1028 Tinkham Rd
- 6 Katie St
- 68 Monson Rd
- 230V Burleigh Rd
- 767 Stony Hill Rd
- 760 Stony Hill Rd
- 17 Peak Rd
- 5 Old Carriage Dr
- 763 Stony Hill Rd
- 14 Brookdale Dr
- 6 Hilltop Park
- 5 Edgewood Rd
- 8 Patriot Ridge Ln
- 751 Ridge Rd
- 12 Highridge Rd
- 407 Monson Rd
- 19 Forest Hill Rd
- 374
- 390 Soule Rd
- 2 Bayberry Dr Unit 51