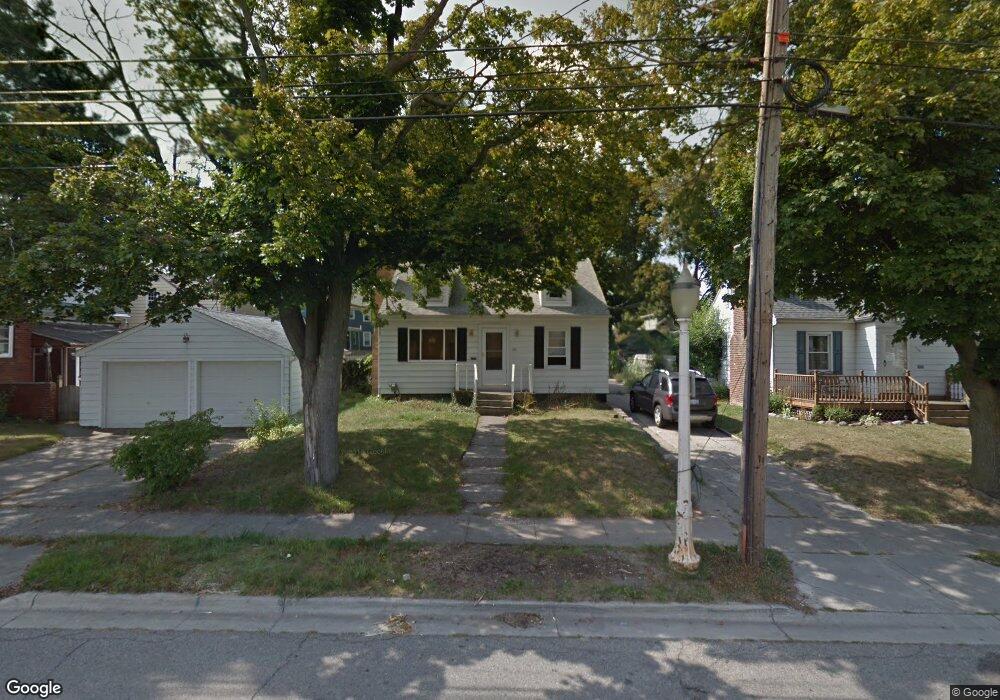
711 Merrill St Lansing, MI 48912
Foster NeighborhoodEstimated Value: $164,203 - $227,000
3
Beds
2
Baths
1,091
Sq Ft
$174/Sq Ft
Est. Value
About This Home
This home is located at 711 Merrill St, Lansing, MI 48912 and is currently estimated at $189,301, approximately $173 per square foot. 711 Merrill St is a home located in Ingham County with nearby schools including Pattengill Academy, Willow School, and Eastern High School.
Ownership History
Date
Name
Owned For
Owner Type
Purchase Details
Closed on
Sep 30, 2014
Sold by
Balla Malik
Bought by
Hassabelnabi Mohamed
Current Estimated Value
Purchase Details
Closed on
Aug 7, 2014
Sold by
Ingham County
Bought by
Balla Malik
Purchase Details
Closed on
Dec 19, 2005
Sold by
Chiwocha Farai Eiunice
Bought by
Chiwocha Tapera Albert
Purchase Details
Closed on
Dec 16, 2005
Sold by
Federal Home Loan Mortgage Corporation
Bought by
Chiwocha Farai E
Purchase Details
Closed on
Sep 22, 2005
Sold by
Mikulcik Karen E
Bought by
Department Of Treasury State Michigan
Purchase Details
Closed on
Jun 25, 2001
Sold by
Mikulcik Karen E
Bought by
Mikulcik Karen Elizabeth and Trust Of Karen Elizabeth Mikulcik
Purchase Details
Closed on
Oct 1, 1992
Create a Home Valuation Report for This Property
The Home Valuation Report is an in-depth analysis detailing your home's value as well as a comparison with similar homes in the area
Home Values in the Area
Average Home Value in this Area
Purchase History
| Date | Buyer | Sale Price | Title Company |
|---|---|---|---|
| Hassabelnabi Mohamed | -- | None Available | |
| Balla Malik | $40,000 | None Available | |
| Chiwocha Tapera Albert | -- | None Available | |
| Chiwocha Farai E | -- | Fatic | |
| Department Of Treasury State Michigan | $102,987 | None Available | |
| Mikulcik Karen Elizabeth | -- | -- | |
| -- | $69,900 | -- |
Source: Public Records
Tax History
| Year | Tax Paid | Tax Assessment Tax Assessment Total Assessment is a certain percentage of the fair market value that is determined by local assessors to be the total taxable value of land and additions on the property. | Land | Improvement |
|---|---|---|---|---|
| 2025 | $4,031 | $76,800 | $11,300 | $65,500 |
| 2024 | $34 | $68,600 | $11,300 | $57,300 |
| 2023 | $3,791 | $62,600 | $11,300 | $51,300 |
| 2022 | $3,459 | $57,900 | $9,300 | $48,600 |
| 2021 | $3,378 | $53,300 | $7,900 | $45,400 |
| 2020 | $3,355 | $49,800 | $7,900 | $41,900 |
| 2019 | $3,244 | $47,400 | $7,900 | $39,500 |
| 2018 | $3,074 | $43,300 | $7,900 | $35,400 |
| 2017 | $2,960 | $43,300 | $7,900 | $35,400 |
| 2016 | $2,821 | $39,900 | $7,900 | $32,000 |
| 2015 | $2,821 | $38,800 | $15,831 | $22,969 |
| 2014 | $2,821 | $37,900 | $9,046 | $28,854 |
Source: Public Records
Map
Nearby Homes
- 2718 E Grand River Ave
- 601 N Francis Ave
- 411 Midvale Ave
- 605 N Fairview Ave
- 229 N Hayford Ave
- 311 N Magnolia Ave
- 605 N Clemens Ave
- 1246 Chester Rd
- 218 N Magnolia Ave Unit 1
- 615 Glenmoor Rd Unit 2A
- 1320 N Foster Ave
- 1411 Chester Rd
- 129 S Francis Ave
- 133 S Francis Ave
- 135 S Francis Ave
- 1311 W Saginaw St
- 728 Audubon Rd
- 224 Mifflin Ave
- 854 Touraine Ave
- 228 Marshall St
- 715 Merrill Ave
- 715 Merrill St
- 2711 E Saginaw St
- 2717 E Saginaw St
- 721 Merrill St
- 721 Merrill Ave
- 712 Newton St
- 2707 E Saginaw St
- 714 Newton St
- 2701 E Saginaw St
- 2701 E Saginaw St Unit 1
- 725 Merrill St
- 720 Newton St
- 725 Merrill Ave
- 724 Newton St
- 729 Merrill St
- 728 Newton St
- 731 Merrill St
- 732 Newton St
- 636 Lasalle Blvd
Your Personal Tour Guide
Ask me questions while you tour the home.