Estimated Value: $289,000 - $289,582
3
Beds
2
Baths
1,200
Sq Ft
$241/Sq Ft
Est. Value
About This Home
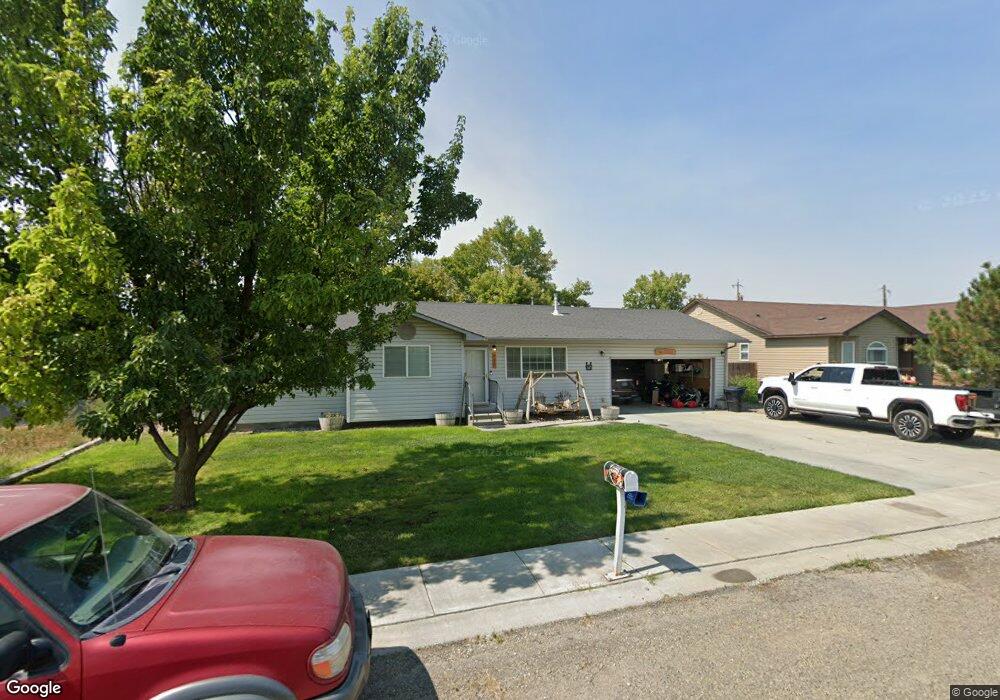
This home is located at 711 N 4th St, Nyssa, OR 97913 and is currently estimated at $289,291, approximately $241 per square foot. 711 N 4th St is a home located in Malheur County with nearby schools including Nyssa Elementary School, Nyssa Middle School, and Nyssa High School.
Ownership History
Date
Name
Owned For
Owner Type
Purchase Details
Closed on
Jun 23, 2025
Sold by
Holliday Janice E
Bought by
Holliday Mitchell L and Holliday Hailey L
Current Estimated Value
Home Financials for this Owner
Home Financials are based on the most recent Mortgage that was taken out on this home.
Original Mortgage
$108,000
Outstanding Balance
$107,723
Interest Rate
6.81%
Mortgage Type
New Conventional
Estimated Equity
$181,568
Purchase Details
Closed on
Sep 19, 2022
Sold by
Holliday Janice E
Bought by
Holliday Janice E and Holliday Hailey L
Create a Home Valuation Report for This Property
The Home Valuation Report is an in-depth analysis detailing your home's value as well as a comparison with similar homes in the area
Home Values in the Area
Average Home Value in this Area
Purchase History
| Date | Buyer | Sale Price | Title Company |
|---|---|---|---|
| Holliday Mitchell L | -- | Amerititle | |
| Holliday Janice E | -- | None Listed On Document |
Source: Public Records
Mortgage History
| Date | Status | Borrower | Loan Amount |
|---|---|---|---|
| Open | Holliday Mitchell L | $108,000 |
Source: Public Records
Tax History
| Year | Tax Paid | Tax Assessment Tax Assessment Total Assessment is a certain percentage of the fair market value that is determined by local assessors to be the total taxable value of land and additions on the property. | Land | Improvement |
|---|---|---|---|---|
| 2025 | $2,268 | $129,364 | $9,964 | $119,400 |
| 2024 | $2,211 | $125,597 | $11,259 | $114,338 |
| 2023 | $2,154 | $121,939 | $13,078 | $108,861 |
| 2022 | $1,680 | $118,388 | $17,356 | $101,032 |
| 2021 | $2,050 | $114,940 | $15,558 | $99,382 |
| 2020 | $1,996 | $111,593 | $16,831 | $94,762 |
| 2019 | $1,944 | $108,343 | $16,894 | $91,449 |
| 2018 | $1,885 | $105,188 | $18,825 | $86,363 |
| 2017 | $1,783 | $102,125 | $18,277 | $83,848 |
| 2016 | $1,778 | $99,151 | $17,745 | $81,406 |
| 2015 | $1,575 | $96,264 | $17,464 | $78,800 |
| 2014 | $1,717 | $93,461 | $18,527 | $74,934 |
Source: Public Records
Map
Nearby Homes
- 717 N 3rd St
- 824 N 5th St
- 830 N 5th St
- 525 N 4th St
- 539 N 2nd St
- 416 N 2nd St
- 904 Oak St Unit 44
- 613 Park Ave
- 617 Park Ave
- lot2 plat 2411 Oregon 201
- lot3 plat 2411 Oregon 201
- 213 Ehrgood Ave
- 1770 N 3rd St
- 110 E Main St
- 108 E Main St
- 106 E Main St
- 112 E Main St
- 813 Reece Ave
- 2150 Park Ave
- TBD Sunset View Road (Lot 5)
Your Personal Tour Guide
Ask me questions while you tour the home.