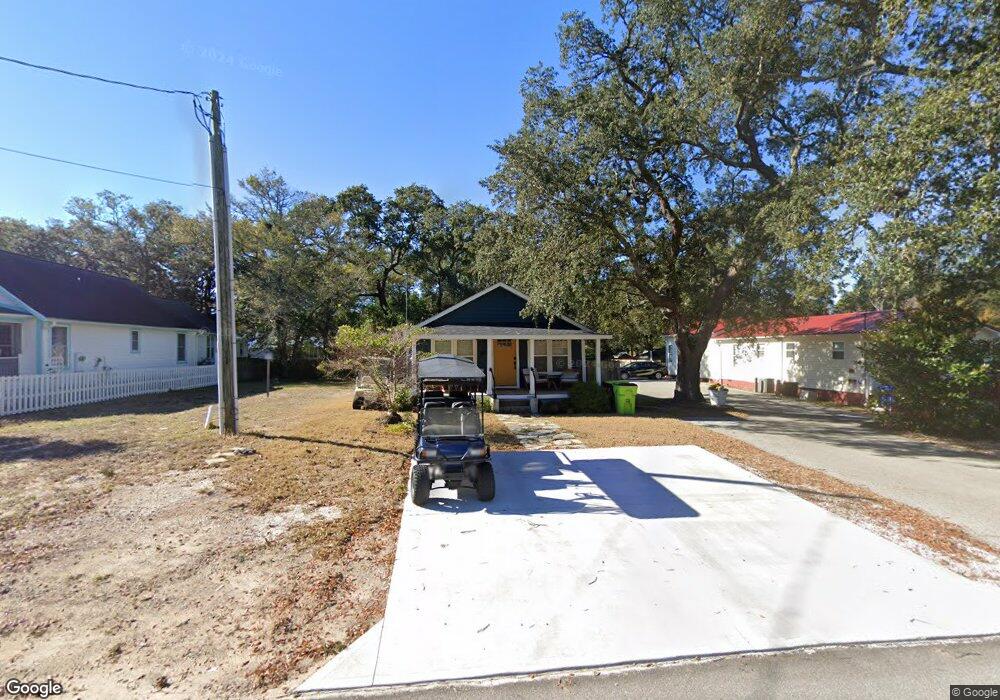
711 N Caswell Ave Unit 12 Southport, NC 28461
Estimated Value: $462,401 - $696,000
3
Beds
3
Baths
1,488
Sq Ft
$380/Sq Ft
Est. Value
About This Home
This home is located at 711 N Caswell Ave Unit 12, Southport, NC 28461 and is currently estimated at $564,850, approximately $379 per square foot. 711 N Caswell Ave Unit 12 is a home located in Brunswick County with nearby schools including Southport Elementary School, South Brunswick Middle School, and South Brunswick High School.
Ownership History
Date
Name
Owned For
Owner Type
Purchase Details
Closed on
Nov 17, 2020
Sold by
Crenshaw Dave and Crenshaw Diane
Bought by
Hegler Arnold Shan and Hegler Pamela
Current Estimated Value
Home Financials for this Owner
Home Financials are based on the most recent Mortgage that was taken out on this home.
Original Mortgage
$403,522
Outstanding Balance
$359,077
Interest Rate
2.8%
Mortgage Type
VA
Estimated Equity
$205,773
Purchase Details
Closed on
Oct 19, 2019
Sold by
Murakata Linda A
Bought by
Crenshaw Dave and Crenshaw Diane
Purchase Details
Closed on
Jun 6, 2019
Sold by
Murakata Linda A
Bought by
Crenshaw Dave and Crenshaw Diane
Purchase Details
Closed on
May 12, 2015
Sold by
Drey William Burns
Bought by
Murakata Linda A
Purchase Details
Closed on
Sep 1, 2002
Bought by
Drey William Burns
Create a Home Valuation Report for This Property
The Home Valuation Report is an in-depth analysis detailing your home's value as well as a comparison with similar homes in the area
Home Values in the Area
Average Home Value in this Area
Purchase History
| Date | Buyer | Sale Price | Title Company |
|---|---|---|---|
| Hegler Arnold Shan | -- | None Available | |
| Hegler Arnold Shan | $400,000 | None Listed On Document | |
| Crenshaw Dave | -- | None Available | |
| Crenshaw Dave | $124,000 | None Available | |
| Murakata Linda A | $37,000 | None Available | |
| Drey William Burns | $68,500 | -- |
Source: Public Records
Mortgage History
| Date | Status | Borrower | Loan Amount |
|---|---|---|---|
| Open | Hegler Arnold Shan | $403,522 | |
| Closed | Hegler Arnold Shan | $403,522 |
Source: Public Records
Tax History Compared to Growth
Tax History
| Year | Tax Paid | Tax Assessment Tax Assessment Total Assessment is a certain percentage of the fair market value that is determined by local assessors to be the total taxable value of land and additions on the property. | Land | Improvement |
|---|---|---|---|---|
| 2025 | $2,802 | $376,070 | $71,000 | $305,070 |
| 2024 | $2,802 | $376,070 | $71,000 | $305,070 |
| 2023 | $2,459 | $376,070 | $71,000 | $305,070 |
| 2022 | $2,459 | $245,360 | $36,000 | $209,360 |
| 2021 | $2,151 | $245,360 | $36,000 | $209,360 |
| 2020 | $902 | $101,510 | $36,000 | $65,510 |
| 2019 | $902 | $39,030 | $36,000 | $3,030 |
| 2018 | $720 | $27,600 | $24,000 | $3,600 |
| 2017 | $714 | $27,600 | $24,000 | $3,600 |
| 2016 | $662 | $27,600 | $24,000 | $3,600 |
| 2015 | $662 | $79,410 | $24,000 | $55,410 |
| 2014 | -- | $97,270 | $40,000 | $57,270 |
Source: Public Records
Map
Nearby Homes
- 29 N Caswell Ave
- Lot 5a N Caswell Ave
- 801 N Caswell Ave
- Lot 8 Clarendon Ave
- 520 Clarendon Ave
- 611 N Burrington Ave
- 205 W Leonard St
- 826 N Caswell Ave
- 822 N Lord St
- 1163 N Caswell Ave
- 27 Lots N Caswell Ave
- 742 Skipjack Cir
- 617 Port Haven Way
- 120 W 9th St
- 908 N Lord St
- Tr-1 W 9th St
- Tr-2 W 9th St
- 716 N Atlantic Ave
- 409 N Lord St
- 403 N Howe St
- 711 N Caswell Ave
- 707 N Caswell Ave
- 713 N Caswell Ave
- 705 N Caswell Ave
- 712 Clarendon Ave
- 708 Clarendon Ave
- 718 Clarendon Ave
- 710 N Caswell Ave
- 722 Clarendon Ave
- 706 N Caswell Ave
- 704 N Caswell Ave
- 619 N Caswell Ave
- 617 N Caswell Ave
- 0 W Owens St
- 12 W Owens St
- 315 W 8th St
- 715 Clarendon Ave
- 705 Clarendon Ave
- 215 W Owens St
- 717 Clarendon Ave