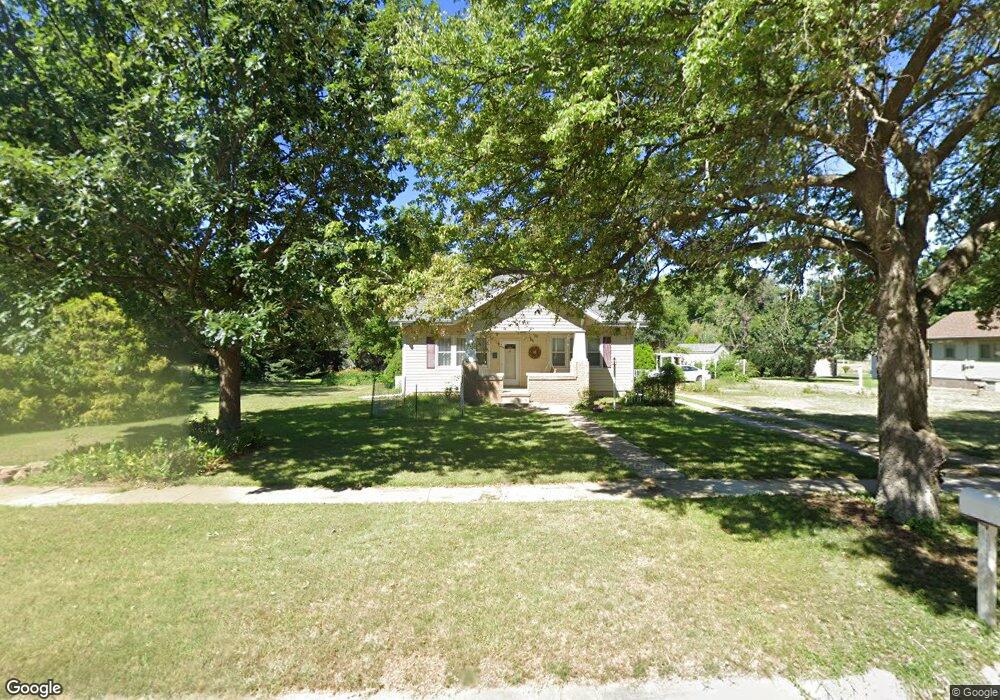
711 N Hull Ave Minden, NE 68959
Estimated Value: $118,000 - $152,332
--
Bed
--
Bath
884
Sq Ft
$153/Sq Ft
Est. Value
About This Home
This home is located at 711 N Hull Ave, Minden, NE 68959 and is currently estimated at $135,333, approximately $153 per square foot. 711 N Hull Ave is a home located in Kearney County with nearby schools including Minden East Elementary School, C.L. Jones Middle School, and Minden High School.
Ownership History
Date
Name
Owned For
Owner Type
Purchase Details
Closed on
Aug 8, 2022
Sold by
Aubrey Scheibel
Bought by
Fredrickson Brady James
Current Estimated Value
Home Financials for this Owner
Home Financials are based on the most recent Mortgage that was taken out on this home.
Original Mortgage
$111,550
Outstanding Balance
$106,806
Interest Rate
5.7%
Mortgage Type
Balloon
Estimated Equity
$28,527
Purchase Details
Closed on
Oct 3, 2019
Sold by
Galles Gregory L
Bought by
First National Bank
Purchase Details
Closed on
Oct 7, 2008
Sold by
Schluntz Christian and Brooks Judith Kathleen
Bought by
Anderson Alden Shawn
Create a Home Valuation Report for This Property
The Home Valuation Report is an in-depth analysis detailing your home's value as well as a comparison with similar homes in the area
Home Values in the Area
Average Home Value in this Area
Purchase History
| Date | Buyer | Sale Price | Title Company |
|---|---|---|---|
| Fredrickson Brady James | $115,000 | None Listed On Document | |
| First National Bank | $72,000 | None Available | |
| Anderson Alden Shawn | $40,000 | -- |
Source: Public Records
Mortgage History
| Date | Status | Borrower | Loan Amount |
|---|---|---|---|
| Open | Fredrickson Brady James | $111,550 | |
| Previous Owner | Anderson Alden Shawn | $49,490 |
Source: Public Records
Tax History Compared to Growth
Tax History
| Year | Tax Paid | Tax Assessment Tax Assessment Total Assessment is a certain percentage of the fair market value that is determined by local assessors to be the total taxable value of land and additions on the property. | Land | Improvement |
|---|---|---|---|---|
| 2024 | $1,646 | $123,310 | $26,270 | $97,040 |
| 2023 | $2,104 | $119,720 | $25,505 | $94,215 |
| 2022 | $2,124 | $115,945 | $14,545 | $101,400 |
| 2021 | $1,826 | $102,720 | $14,545 | $88,175 |
| 2020 | $1,574 | $88,030 | $14,545 | $73,485 |
| 2019 | $1,376 | $83,220 | $14,545 | $68,675 |
| 2018 | $1,342 | $83,220 | $14,545 | $68,675 |
| 2017 | $1,279 | $80,780 | $14,545 | $66,235 |
| 2016 | $1,224 | $77,030 | $14,545 | $62,485 |
| 2015 | $1,632 | $64,930 | $14,545 | $50,385 |
| 2014 | $1,632 | $64,930 | $14,545 | $50,385 |
Source: Public Records
Map
Nearby Homes
- 710 N Minden Ave
- 221 E 2nd St
- TBD N Brown Ave
- 423 N Tower Ave
- 219 N Brown Ave
- 214 E Holland St
- 508 W 5th St
- 442 W 1st St
- 643 S Brown Ave
- 550 S Blaine Ave
- 773 S Logan Ave
- 545 Webster St
- 309 Oak St
- 100 35 Rd
- L1B2 Craneview 3rd Subdivison
- Lots 5-7 Block 3 Craneview Third S Road Awarii Dunes
- 402 2nd Ave
- 4 Tulleymore Ln
- 809 A Ave
- L4B3 Quail Run Unit L4 B3 Awarii Dunes
- 729 N Hull Ave
- 710 N Hubbard Ave
- 714 N Hull Ave
- 720 N Hubbard Ave
- 645 N Hull Ave
- 743 N Hull Ave
- 742 N Hubbard Ave
- 642 N Hubbard Ave
- 734 N Hull Ave
- 627 N Hull Ave
- 644 N Hull Ave
- 736 N Hull Ave
- 628 N Hubbard Ave
- 619 N Hull Ave
- 614 N Hubbard Ave
- 642 E 8th St
- 632 E 8th St
- 620 N Hull Ave
- 607 N Hull Ave
- 616 E 8th St