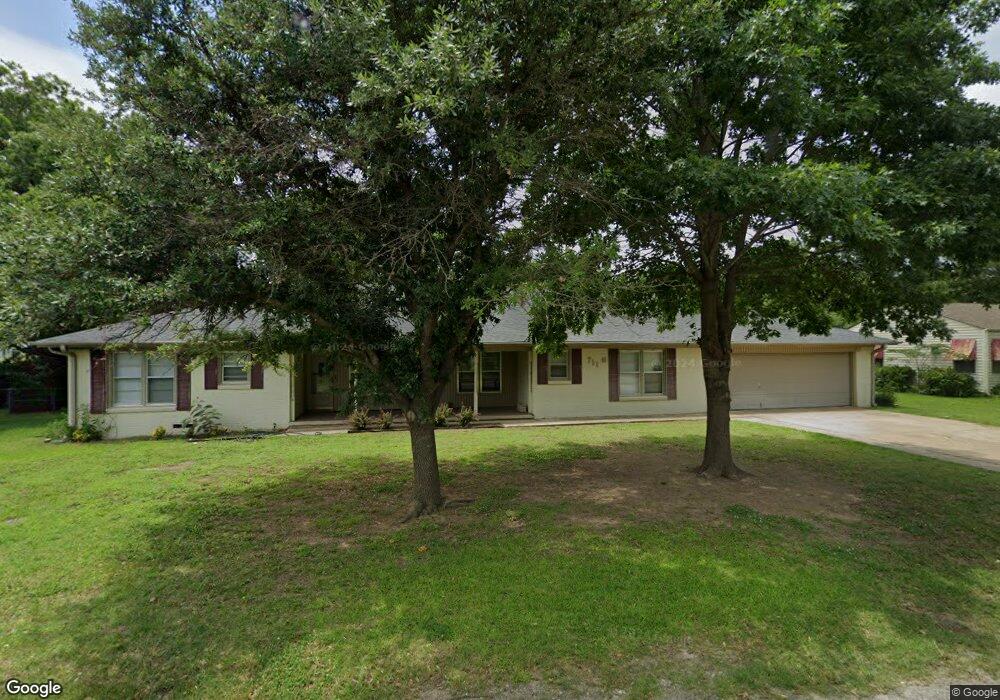
711 N St SW Ardmore, OK 73401
Estimated Value: $223,000 - $293,000
Highlights
- 1 Fireplace
- Bungalow
- Floor Furnace
- Window Unit Cooling System
- Ceiling Fan
- Wood Siding
About This Home
As of July 2014Great Investment Property. New Carpet & Laminate. Fresh Interior Paint. Window Unit / Wall Furnace. Living/Dining Combo. Carport in Rear with Storage. MOTIVATED SELLER - SELLER WILL PAY $2500.00 TOWARD BUYER'S CLOSING COSTS AND PREPAIDS.
Home Details
Home Type
- Single Family
Est. Annual Taxes
- $209
Year Built
- Built in 1955
Lot Details
- 0.34
Home Design
- Bungalow
- Wood Siding
Interior Spaces
- 1,141 Sq Ft Home
- 1-Story Property
- Ceiling Fan
- 1 Fireplace
- Carpet
- Crawl Space
Bedrooms and Bathrooms
- 3 Bedrooms
- 1 Full Bathroom
Utilities
- Window Unit Cooling System
- Zoned Cooling
- Floor Furnace
- Gas Water Heater
Community Details
- Ardmorelot Subdivision
Ownership History
Purchase Details
Home Values in the Area
Average Home Value in this Area
Purchase History
| Date | Buyer | Sale Price | Title Company |
|---|---|---|---|
| Owens Brent Lance | $58,000 | -- |
Property History
| Date | Event | Price | List to Sale | Price per Sq Ft |
|---|---|---|---|---|
| 07/30/2014 07/30/14 | Sold | $40,000 | -19.8% | $35 / Sq Ft |
| 04/11/2013 04/11/13 | Pending | -- | -- | -- |
| 04/11/2013 04/11/13 | For Sale | $49,900 | -- | $44 / Sq Ft |
Tax History Compared to Growth
Tax History
| Year | Tax Paid | Tax Assessment Tax Assessment Total Assessment is a certain percentage of the fair market value that is determined by local assessors to be the total taxable value of land and additions on the property. | Land | Improvement |
|---|---|---|---|---|
| 2024 | $2,453 | $22,696 | $514 | $22,182 |
| 2023 | $2,265 | $21,616 | $514 | $21,102 |
| 2022 | $1,968 | $20,586 | $514 | $20,072 |
| 2021 | $1,978 | $19,606 | $514 | $19,092 |
| 2020 | $1,857 | $18,673 | $1,800 | $16,873 |
| 2019 | $1,813 | $18,673 | $1,800 | $16,873 |
| 2018 | $1,843 | $18,673 | $1,800 | $16,873 |
| 2017 | $1,707 | $18,673 | $1,800 | $16,873 |
| 2016 | $1,731 | $18,571 | $1,343 | $17,228 |
| 2015 | $1,359 | $17,687 | $780 | $16,907 |
| 2014 | $1,581 | $17,670 | $780 | $16,890 |
Map
Source: MLS Technology
MLS Number: 26567
APN: 1990-36-04S-01E-1-010-00
Disclaimer: Certain information contained herein is derived from information provided by parties other than Homes.com. All information provided is deemed reliable, but is not guaranteed to be accurate and should be independently verified.
![]() IDX information is provided exclusively for personal, non-commercial use, and may not be used for any purpose other than to identify prospective properties consumers may be interested in purchasing.
IDX information is provided exclusively for personal, non-commercial use, and may not be used for any purpose other than to identify prospective properties consumers may be interested in purchasing.
Information is deemed reliable but not guaranteed.
- 711 N St SW
- 1418 3rd Ave SW
- 1201 5th Ave SW
- 407 S Commerce St
- 1203 SW 4th
- 1317 3rd Ave SW
- 307 P St SW
- 1301 3rd Ave SW
- 1424 Stanley St SW
- 1616 6th Ave SW
- 924 Manor Mall
- 416 Wheeler St SW
- 930 P St SW Unit 3
- 1703 3rd Ave SW
- 917 Q St SW
- 532 Hammers Rd
- 1209 Stanley St SW
- 1800 SW 6th St
- 1206 Bixby St
- 420 K St SW